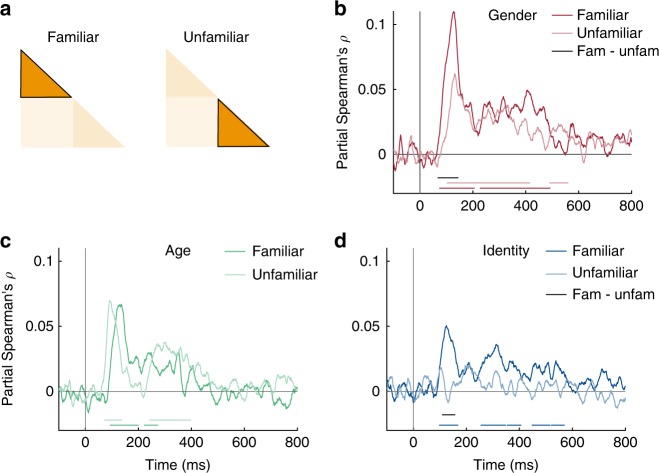
Fig. 3.
Effect of familiarity on face representations. a We conducted separate RSA analyses for familiar and unfamiliar faces (n = 16). Note that this reduces the amount of data fourfold. b–d Time course of partial Spearman correlations between MEG RDMs and gender (b), age (c) and identity (d) separated for familiar and unfamiliar faces, partialling out other models and low-level features (see Methods). Colored lines below plots indicate significant times, and black lines indicate significant difference between conditions both using cluster-based sign permutation test (cluster-defining threshold p < 0.05, and corrected significance level p < 0.05). Source data are provided as a Source Data file

