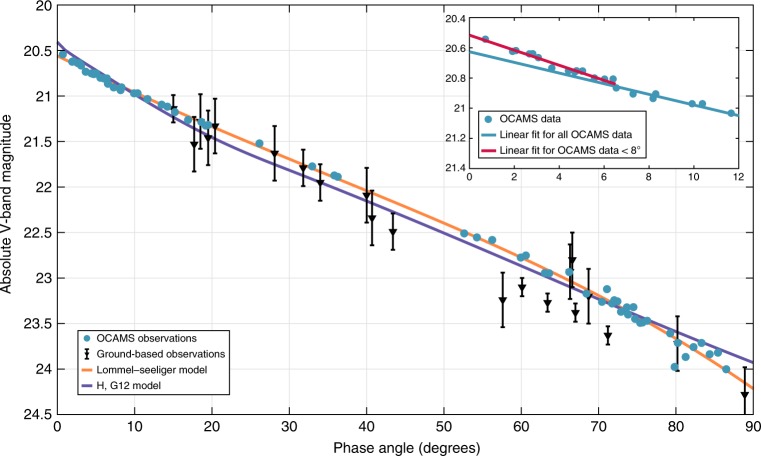
Fig. 3.
Phase function observations and models for Bennu. Over-plotted are the model fits to the new data: a Lommel-Seeliger model and a revised H,G12 model. The ground-based measurements are published in18. We originally converted the ground-based measurements to the v-band magnitude scale, plotted with 1-sigma photometric error bars. The 1-sigma photometric error bars for OCAMS data are less than or equal to the size of the data points. Inset, upper right: The OSIRIS-REx measurements at low phase angles (0 to 12 degrees). We plot this subset of the data to illustrate the small opposition effect present for asteroid Bennu. The small opposition effect is consistent with what we would expect for low-albedo, carbonaceous bodies. The red line is the linear fit to observations made at less than 7.5 degrees phase angle. The blue line is the linear fit to all OSIRIS-REx data points at greater than 7.5 degrees phase angle. Source data are provided in Supplementary Tables 2 and 3

