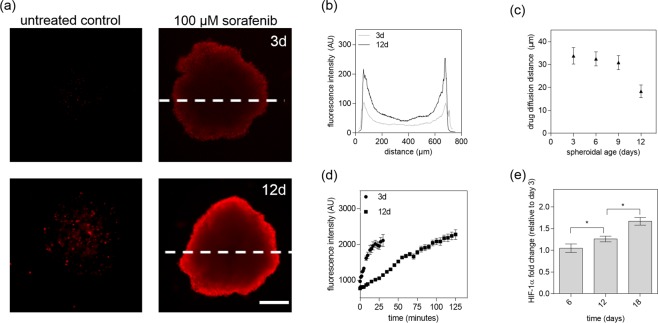
Figure 7.
(a) Fluorescence images of early- (top panel) and late-stage (bottom panel) HepG2 spheroids with necrotic edges (red) after 24 hours of sorafenib exposure at a concentration of 0 µM and 100 µM. Scale bar, 200 µm. (b) Fluorescence intensity profile of early- and late-stage HepG2 spheroid images after treatment of 100 µM sorafenib for 24 hours. (c) Drug diffusion distance of sorafenib at a concentration of 100 µM after 24 hours exposure with respect to spheroidal age of HepG2 spheroids. Error bars represent ± SD (n = 4). (d) Inward diffusion of the fluorophore rhodamine B of early and late-stage HepG2 spheroids. (e) Fluorescence intensity fold change of HIF-1α immunohistochemical stained HepG2 spheroids relative to day 3 after cultivation time of 6, 12 and 18 days post-seeding. Error bars represent ± SD (n = 4) and *p < 0.05.

