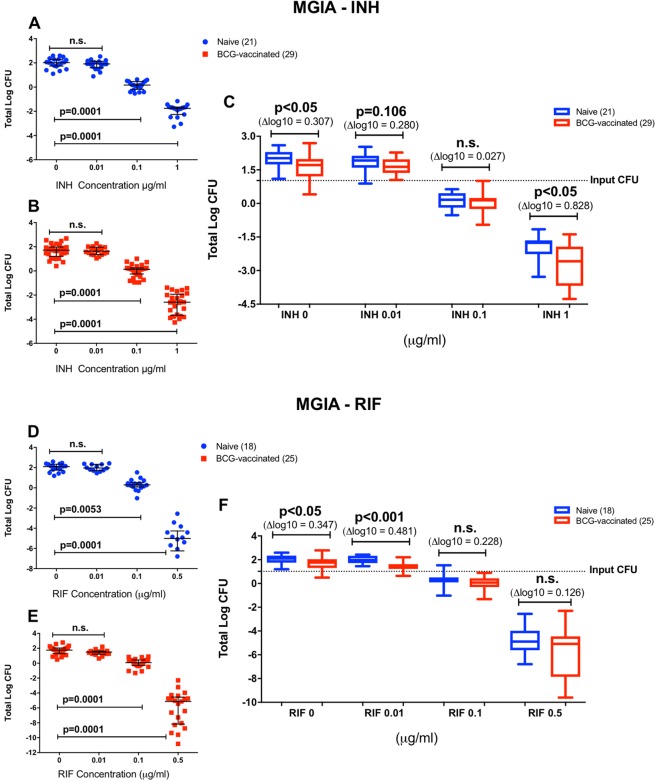
Figure 2.
Growth inhibition in the absence and presence of INH (A) and RIF (B). Mycobacterial growth was assessed in titration curves. INH inhibited mycobacterial growth in a dose-dependent manner in the naïve and vaccinated groups (A,B), as well as RIF (D,E). Data from both groups was compiled in dose-response box plots to identify the BCG effect in addition to the INH- and RIF-mediated killing (C,F). Dots and squares in the titration curves (A,B,D,E) represent individual data points from the participants and the central lines indicate the median response with IQR. Each group is represented in a single box plot with range in the dose-response analysis (C and F). Samples size is indicated in the figure (for INH: n = 29 BCG-vaccinated and n = 21 BCG-naïve participants; for RIF: n = 25 BCG-vaccinated and n = 18 BCG-naïve participants). Statistical significances were tested using one-way ANOVA (A,B,D,E) and unpaired t-test (C,F).

