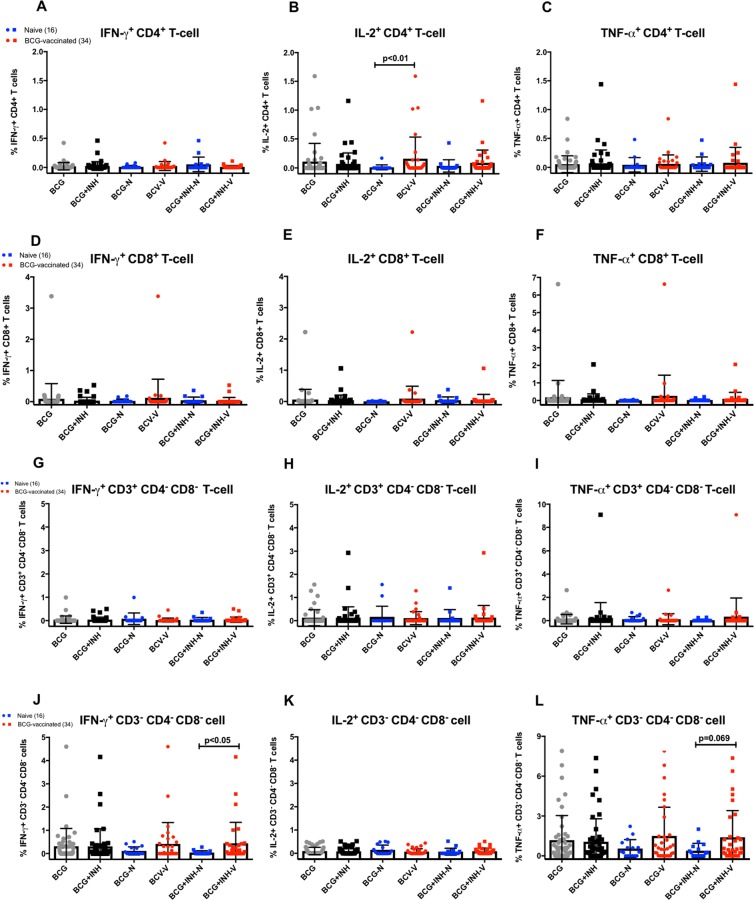
Figure 4.
Frequencies of Th1 cytokine-expressing lymphocytes. Expressions were measured from PBMCs after stimulation with BCG, with and without 1 μg/ml of INH, for 4 days. The grey dot symbols represent stimulation with BCG only, while the black squares represent BCG + INH. Comparisons were made between the naïve (blue) and historically BCG-vaccinated (red) groups. Data is presented as percentages of cell population of interest, and displayed as bar graphs with error bars represent mean ± SD. For this experiment, PBMCs from an alternate cohort of participants were used (Table 1), consisted of 16 naïve and 34 historically BCG-vaccinated participants, with a comparable demographics profile and immune responses as the main cohort. The Mann-Whitney U test was used to determine significance. The P value < 0.05 is considered statistically significant.

