Fig. 1.
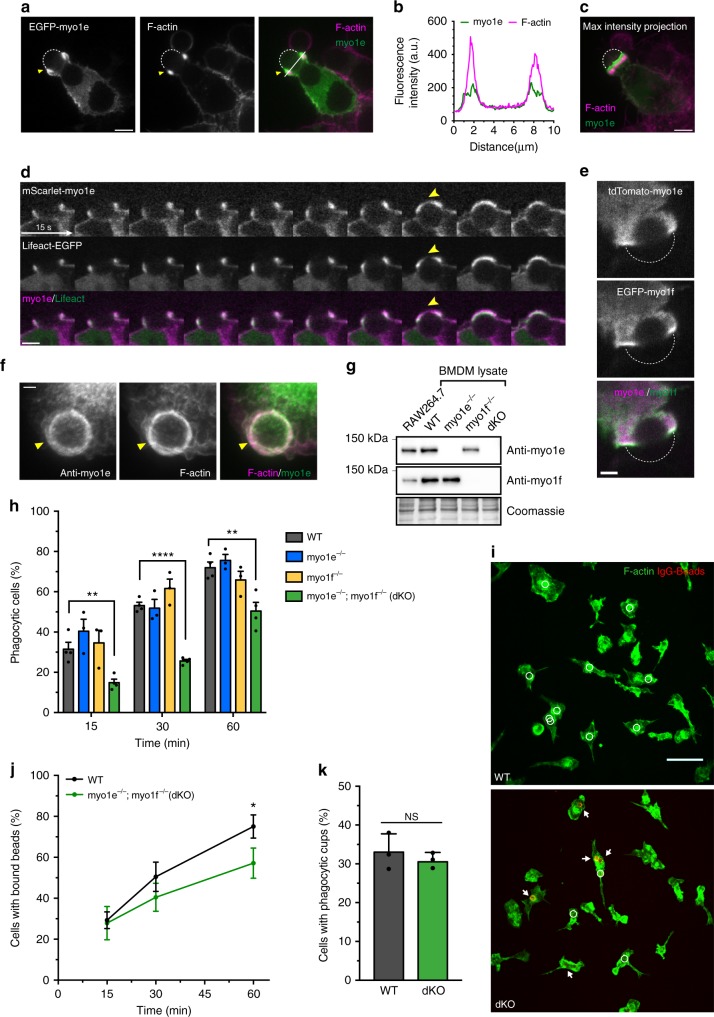
Myo1e/f are required for efficient phagocytosis. a Confocal section of EGFP-myo1e-transfected RAW264.7 macrophage engulfing 6 μm IgG-coated bead and stained with fluorescent phalloidin. Yellow arrowhead indicates the phagocytic cup, dotted line outlines the bead. Scale bar, 5 μm. b Line scan of EGFP-myo1e and F-actin intensity along the line in a. c Maximum intensity projection of a shows that myo1e precedes actin at the cup leading edge. Scale bar, 5 μm. d Time-lapse montage of RAW macrophage expressing mScarlet-myo1e and Lifeact-EGFP engulfing 8 µm IgG-coated bead. Yellow arrowhead points to myo1e preceding F-actin, particularly at cup closure. Scale bar, 5 μm. e Myo1e and myo1f colocalize at the edge of phagocytic cup. Confocal section of tdTomato-myo1e/EGFP-myo1f-transfected RAW macrophage engulfing 6 μm IgG-coated bead (dotted line). Scale bar, 2 μm. f WT BMDM staining with anti-myo1e and phalloidin shows that endogenous myo1e colocalizes with F-actin at the phagocytic cup (arrow) formed around 6 μm IgG-coated bead. Cup is open, facing upward. Total intensity projection of a confocal z-stack. Scale bar, 2 μm. g Western blots of myo1e/f in RAW264.7 cells and WT, myo1e−/−, myo1f−/−, and dKO BMDM. Equal protein loading verified by Coomassie Blue staining. h Percentage (mean ± SEM) of cells that internalized at least one 6 μm IgG-coated bead at 15, 30, and 60 min. Data from three to four experiments. Analysis of 15–30 FOV resulted on average in 1200 cells per genotype quantified per experiment (15 min: p = 0.005; 30 min: p < 0.0001; 60 min: p = 0.006, unpaired t-tests). i Images of phagocytosis assay at 15 min. BMDM are stained with phalloidin (green) and un-internalized beads (arrows) are stained red. White circles denote internalized beads (not visible in the fluorescence image). Scale bar, 50 μm. j Percentage of cells (mean ± SD) that bound at least one bead during phagocytosis time course experiments described in h (15 min: p = 0.7625; 30 min: p = 0.09; 60 min: p = 0.029, unpaired t-tests). k Percentage of cells (mean ± SD) that formed actin-based phagocytic cups at 10 min (p = 0.44, unpaired t-test). Data from three independent experiments. Analysis of 10–18 FOV per experiment resulted in 1026 WT and 1557 dKO cells quantified

