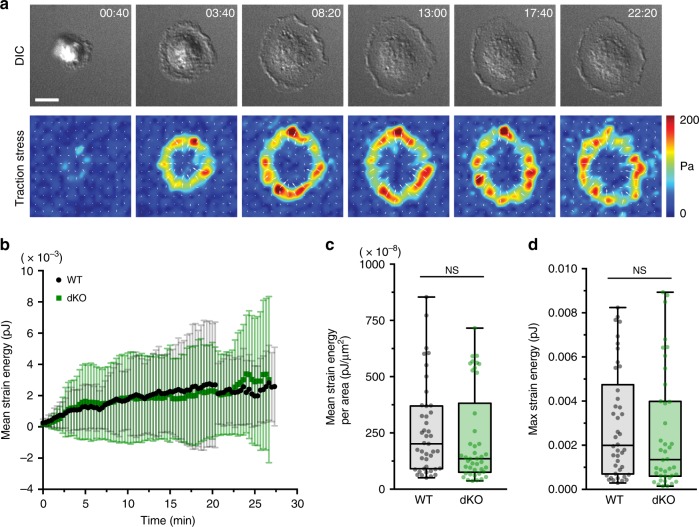
Fig. 2.
Myo1e and myo1f do not contribute to phagocytic contractility. a Representative time-lapse montage of BMDM (dKO macrophage) performing frustrated phagocytosis and exhibiting traction forces. Differential interference contrast (DIC) imaging (top) above traction force map (bottom). The magnitude of the brightness in the traction map corresponds to the magnitude of the stress (i.e., a pixel value of 50 = 50 Pa), with the pixel intensity values color-coded as indicated by the color wedge on the right. Scale bar, 10 μm. See also Supplementary Movie 3. b Graph of mean strain energy (±SD) over time during spreading. WT and dKO macrophages performed frustrated phagocytosis for TFM measurements. Data from two independent experiments (n = 44 WT and 42 dKO cells). c Graph of mean strain energy per unit of cell area. Box and whisker plot shows median, 25th and 75th percentile, with error bars depicting maximum and minimum data points. (n = 43 WT and 42 dKO cells). Two outliers have been removed (p = 0.43, unpaired t-test). d Graph of maximum strain energy measured over 30 min of cell spreading. Box and whisker plot shows median, 25th and 75th percentile, with error bars depicting maximum and minimum data points. (n = 42 WT and 40 dKO cells). Four outliers have been removed (p = 0.48, unpaired t-test)

