Fig. 3.
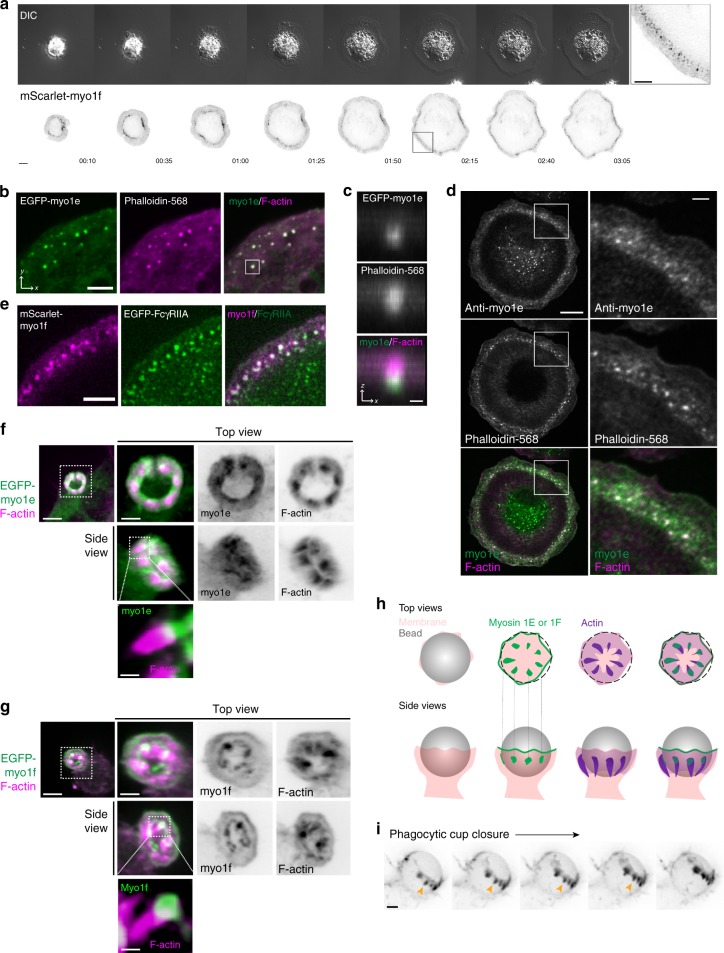
Myo1e and myo1f localize to FcR-actin adhesions during frustrated phagocytosis. a Time-lapse montage of mScarlet-myo1f-transfected RAW macrophage (inverted) conducting frustrated phagocytosis and imaged by DIC (top) and TIRF microscopy (bottom). Scale bar, 10 μm. Zoom of boxed region depicting myo1f puncta is shown on the right. Scale bar, 5 μm. b F-actin colocalizes with myo1e at F-actin puncta. Confocal section of spreading edge of RAW macrophage expressing EGFP-myo1e and stained with Alexa Fluor-568-phalloidin. Scale bar, 5 μm. See also Supplementary Fig. 5a. c xz projection of the boxed region in b showing myo1e at the base of the phagocytic adhesion. Scale bar, 0.5 μm. d Primary macrophages form myo1e-enriched actin punctae during frustrated phagocytosis. WT BMDM spreading on IgG-coated coverslips for 10 min were fixed and stained with myo1e antibody and fluorescently labeled phalloidin. Scale bar, 10 μm. Zoom of boxed region shown on the right. Scale bar, 2 μm. e Myo1f puncta colocalize with Fc receptors. TIRF image of the spreading edge of RAW macrophage co-expressing mScarlet-myo1f and EGFP-FcγRIIA. Scale bar, 5 μm. f, g Phagocytic cups contain plumes of F-actin emanating from discrete myosin-I adhesion sites. 3D representations of phagocytic cup of RAW macrophages transfected with either EGFP-myo1e (f) or EGFP-myo1f (g) and counter-stained with fluorescently labeled phalloidin (bead not outlined). Scale bar, 5 μm; inset scale bar, 2 μm; zoom scale bar, 250 nm. h Graphical representation of myo1e/f and F-actin localization at the phagocytic cup (top view and side view). For the top view, gray bead has been replaced by dotted outline to allow visualization inside the cup. i Actin adhesions within the phagocytic cup move over target during phagocytic internalization. Maximum intensity projection time-lapse montage of RAW macrophage transfected with mEmerald-Lifeact (inverted) engulfing a 7 μm IgG-coated latex bead, imaged by lattice light sheet microscopy. Orange arrowheads point to the actin plumes dynamically progressing along the bead behind the edge of the phagocytic cup. Scale bar, 4 μm

