Fig. 4.
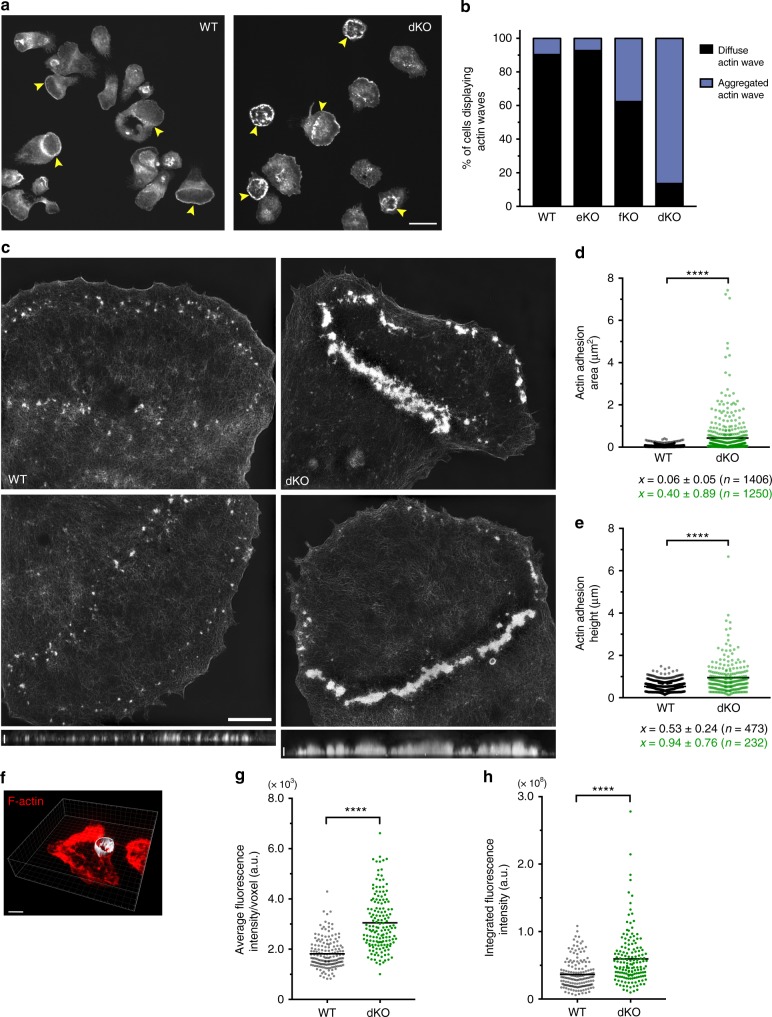
dKO BMDM form disorganized actin adhesions and exhibit denser phagocytic cups. a Representative confocal image of WT and dKO macrophages performing frustrated phagocytosis. Cells spread for 10 min, then were fixed and stained with fluorescently labeled phalloidin. Yellow arrows point to circular actin waves. Scale bar, 20 μm. b Graph of mean percentage of cells forming diffuse or aggregated actin waves in WT, myo1e−/− (eKO), myo1f−/− (fKO), and myo1e−/−; myo1f−/− (dKO) BMDM. Data from 2 to 4 independent experiments. At least 10 FOVs judged blindly per experiment resulting in > 300 cells quantified. c Representative structured illumination microscopy (SIM) images of actin wave in BMDM. Scale bar, 5 μm. xz projections of the entire cell in the lower images are shown below. Scale bar, 1 μm. d Area of individual actin adhesions in WT and dKO macrophages measured using 3D-SIM. Data pooled from two independent experiments. Mean (± SD) annotated below (n = 1406 WT and 1250 dKO individual adhesions from at least 20 cells per genotype, ****p < 0.0001, unpaired t-test). e Height of individual actin adhesions in WT and dKO macrophages measured by 3D-SIM. Data pooled from two independent experiments. Mean (± SD) below (n = 476 WT and 230 dKO adhesions from 10 cells per genotype, ****p < 0.0001, unpaired t-test). f Representative image of segmented phagocytic cup (gray) for fluorescence intensity measurement of F-actin (red). BMDM were challenged with 6 μm IgG-coated latex beads, fixed and stained with fluorescently labeled phalloidin. Phagocytic cup was measured by 3D reconstruction using Imaris software. Scale bar, 5 μm. g, h Mean (black line) fluorescence intensity (g) and integrated fluorescence intensity (h) of F-actin in phagocytic cups of WT and dKO macrophages. Data pooled from three independent experiments (n = 163 WT and 156 dKO cups, ****p < 0.0001, unpaired t-test)

