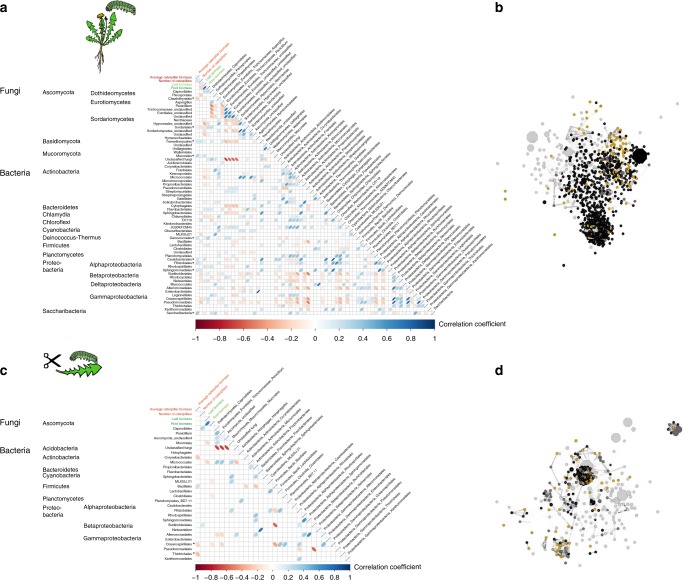
Fig. 4.
Correlations between caterpillar parameters, plant parameters, and relative abundance of fungal and bacterial taxa in the caterpillars. a fungal orders and bacterial classes detected in caterpillars fed on intact plants, and c on detached leaves. Correlations are based on linear Pearson correlation coefficients against each other and average caterpillar biomass (red), caterpillar survival (red), and leaf- and root biomass (green). The scale color of the filled squares indicates the strength of the correlation (r) and whether it is negative (red) or positive (blue). All correlations are corrected with FDR and only significant correlations with p < 0.05 are shown. If the correlation is not significant, the box is left white. Asterisks next to names of taxa mark significant correlation between this taxon and caterpillar performance. b and d represent a network of all significant co-occurrences (Spearman rank correlation coefficient with Bonferroni correction, p < 0.01) of OTUs in caterpillars on intact plants (b) or on detached leaves (d). The size of the nodes represents the relative abundance of the OTUs (weighted average) and the color represents the compartment where it is primary found. Green depicts OTUs found mostly in leaves, brown OTUs in caterpillars (dark brown OTUs of caterpillars on intact plants and light brown OTUs of caterpillars on detached leaves), black depicts OTUs found primarily in the soil and grey OTUs that are general in all compartments

