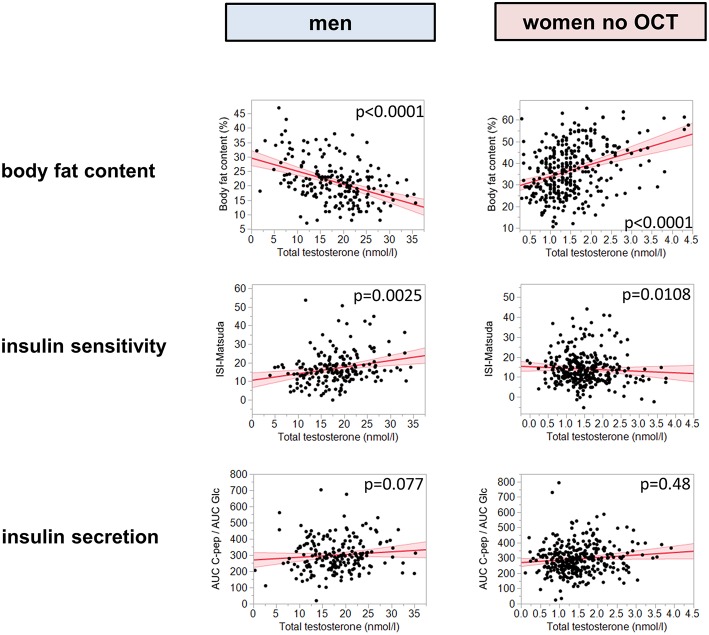
Figure 1.
Presented are metabolic traits plotted against testosterone. The left column presents results for total testosterone in men, the right column presents total testosterone in women without OCT. The first line reports body fat content, the second insulin sensitivity, and the third insulin secretion, assessed as AUC C-peptide/AUC glucose. Red line represents fit line ±95% CI. Associations were tested by multiple linear regression analyses of log-transformed data. Insulin sensitivity was adjusted for body fat content and age, insulin secretion was adjusted for age and insulin sensitivity. OCT, oral contraceptive therapy.

