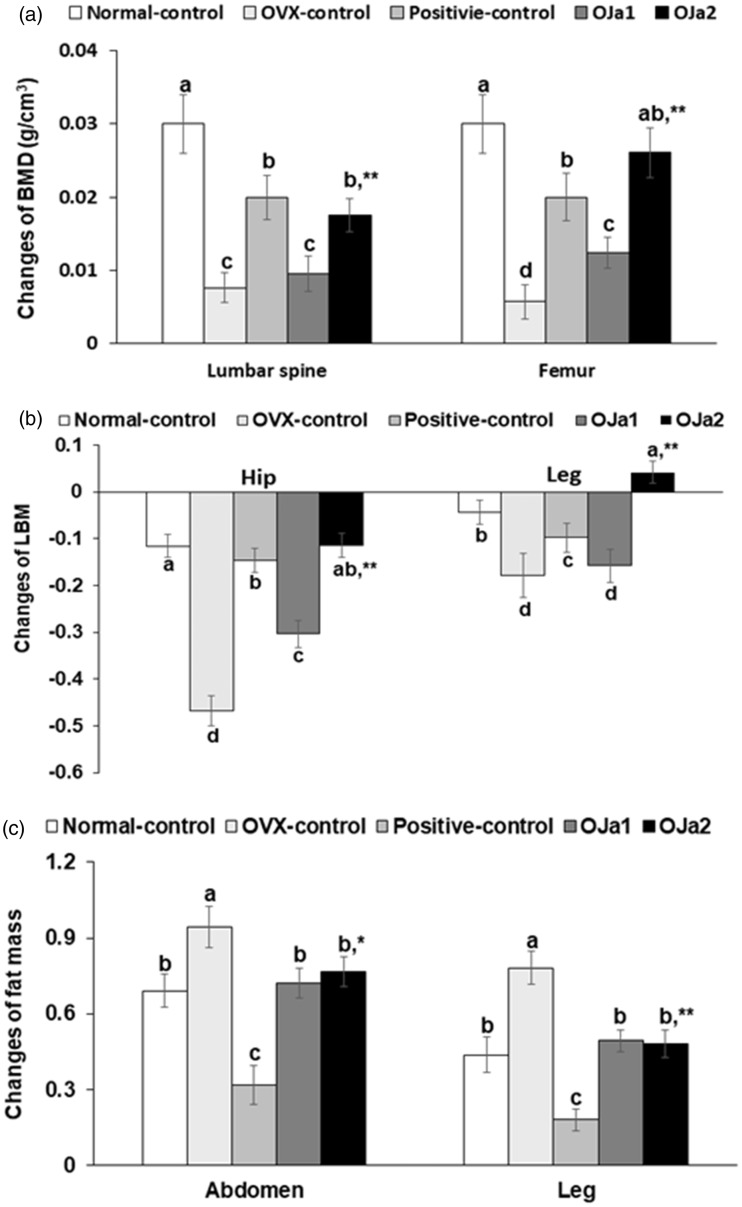
Figure 3.
Bone mineral density (BMD), lean body mass (LBM), and fat mass (FM) at the end of the experiment. OVX-control: the OVX rats consumed 0.5% dextrin; Positive-control: the OVX rats consumed conjugated equine estrogen 150 μg/kg bw + 0.5% dextrin; Normal-control: the sham rats consumed 0.5% dextrin; OJa1: the OVX rats consumed a 0.5% extract of SCB, ACB, MAL, and BPV (1:1:1:1, based on weights); and OJa2: OVX rats consumed 0.5% extract of SCB, PAL, COL and LCM (1:1:1:1, based on weights). At the end of the experimental period, BMD in the lumbar spine and femur (a), LBM in the hip and leg (b) and FM in the abdomen and leg regions (c) were measured by DEXA. Each bar represents the mean ± SD (n=12).
*Significantly different among the groups at each time point by one-way ANOVA at P<0.05.
**at P<0.01.
a,b,cBars with different letters were significantly different among the groups by Tukey test at P<0.05.

