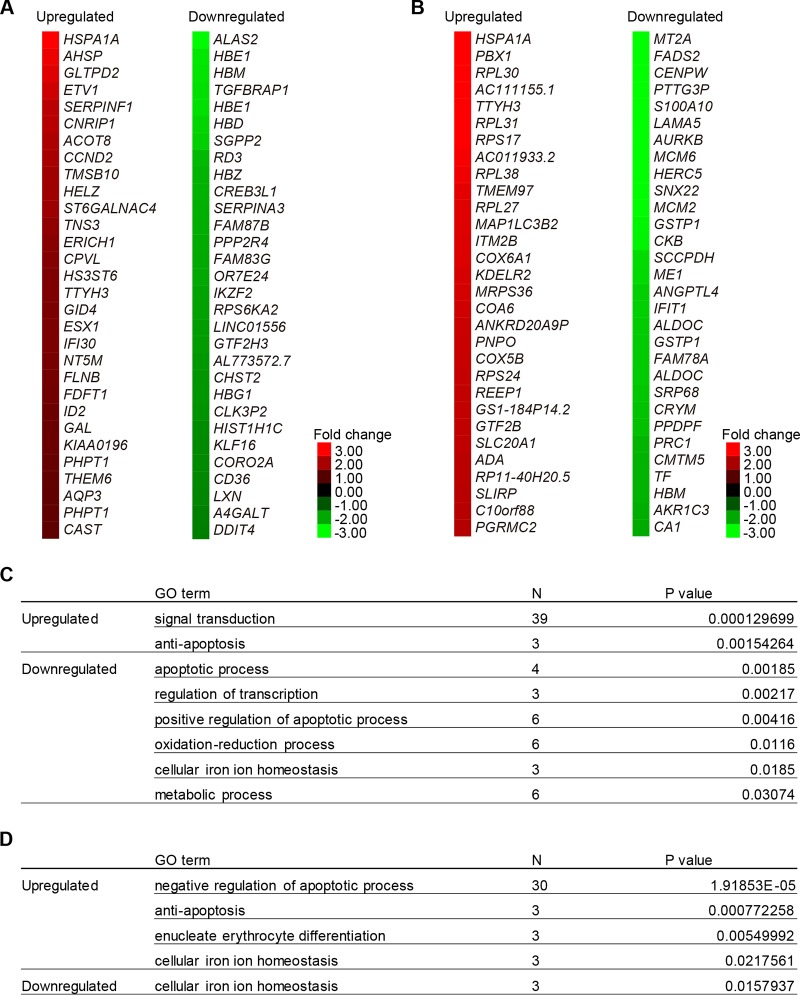
FIG 9.
Expression profiling analysis of ring sideroblasts. (A and B) The heat map depicts the degree of change resulting from ALAS2 mutation in HiDEP cells before coculture (A) and after coculture in the presence of SFC for 6 days (B). The top 30 differentially upregulated or downregulated genes are shown. (C and D) Gene ontology analysis showed genes were upregulated or downregulated by more than 2-fold following ALAS2 mutation, before coculture (C), and after coculture in the presence of SFC (D).

