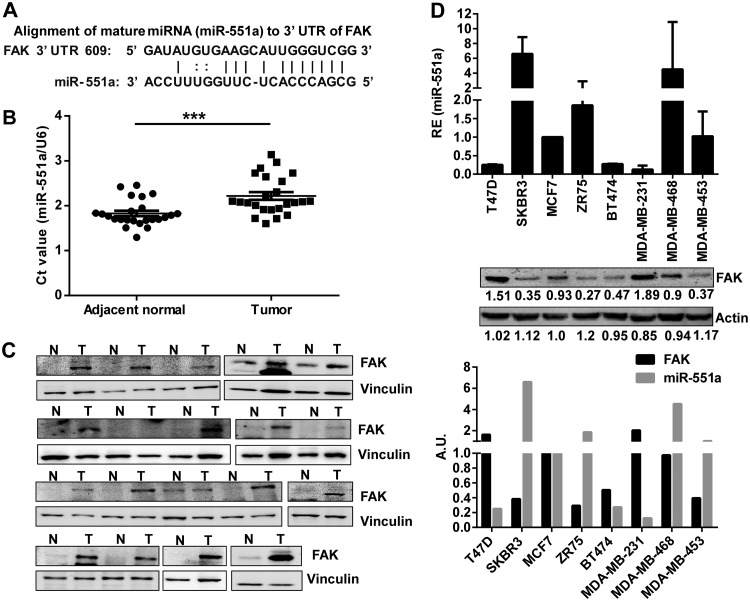
FIG 1.
Inverse relation between FAK and miR-551a expression in breast cancer. (A) Representation of the complementarity between miR-551a and the 3′ UTR of FAK. (B) Scatter plot showing the expression of miR-551a in terms of the threshold cycle (CT) value normalized to that of U6 in breast tumors and adjacent normal breast tissues (n = 24; ***, P = 0.0006, unpaired t test). (C) Western blot images showing FAK expression in breast tumors. (D) Bar graph and Western blot showing the expression of miR-551a and FAK, respectively, in breast cancer cell lines. The bar graph represents the inverse relation between FAK, normalized to the level of actin, and miR-551a expression (bottom panel). AU, arbitrary units; RE, relative expression; N, normal tissue; T, tumor.

