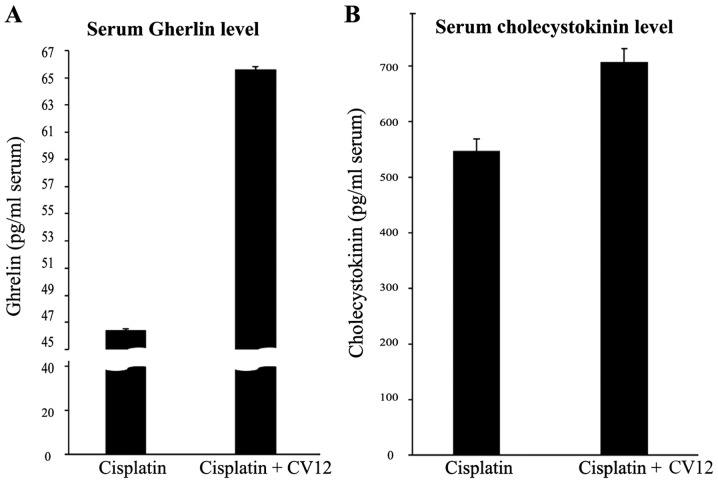
Figure 2.
Serum ghrelin and cholecystokinin levels. Serum ghrelin (A) and cholecystokinin (B) levels were compared between the Cisplatin + CV12 group and the Cisplatin group. The Mann-Whitney U-test was used for comparison. Groups: Cisplatin, control group in the cisplatin injection-induced anorexia rat model; Cisplatin + CV12, CV12 electroacupuncture group in the cisplatin injection-induced anorexia rat model.

