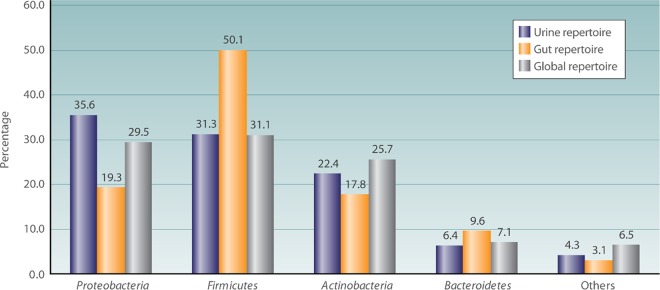
FIG 2.
Comparison of the percentage of repartition of the most-represented phyla in the human urinary tract bacterial repertoire, the human gut repertoire, and the human global repertoire. This histogram represents the percentage of taxa in the main phyla in the human urinary tract repertoire, compared to those in the human gut and human global repertoires.

