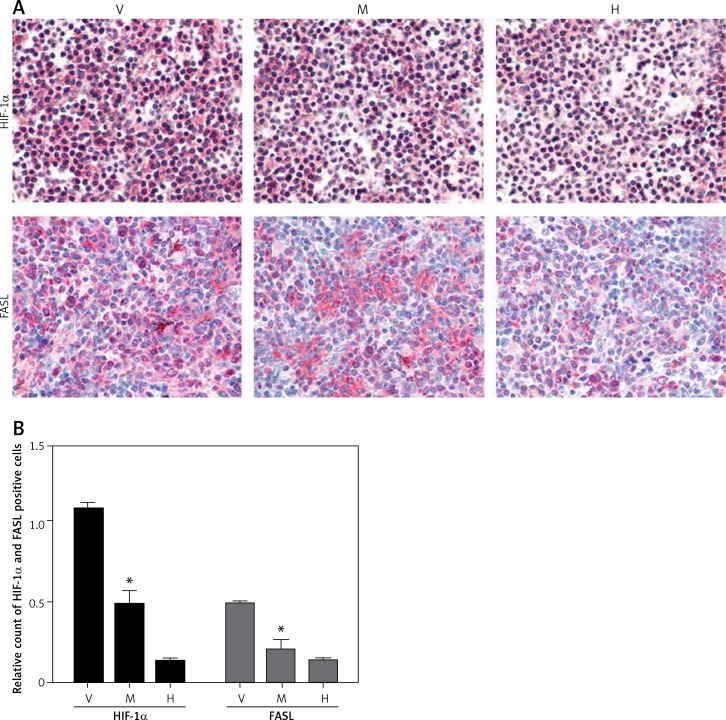
Figure 3.
Immunohistochemical staining of HIF-1α and FASL. A – The upper panel in the figure demonstrates the expression of HIF-1α (pink) with reduced expression in the minocycline-treated group (M) compared to the vehicle (V) group (control). H represents the healthy group. The lower panel presents the expression of FASL, which shows that minocycline can reduce the FASL expression and regulate FAS-mediated cell death (400×). B – Quantification of HIF-1α and FASL positive cells
Values are expressed as mean ± SEM and were considered significant at p < 0.05 (*p < 0.05 vs. vehicle group, **p < 0.01 vs. vehicle group)

