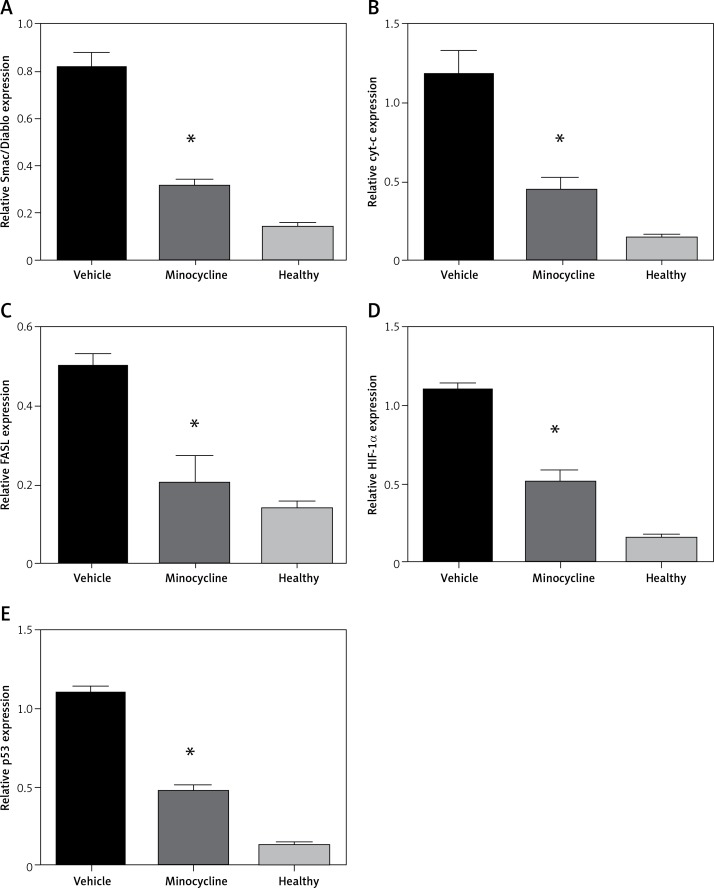
Figure 4.
Relative quantification of mRNA. The graphs represent the relative mRNA expression of Smac/Diablo, cytochrome-c (cyt-c), FASL, HIF-1α, p53 (A–E). There was a significant reduction in expression in the minocycline-treated group compared to the vehicle group. All values are expressed as mean ± SEM and considered significant at p < 0.05
*P < 0.05 vs. vehicle group, **p < 0.01 vs. vehicle group

