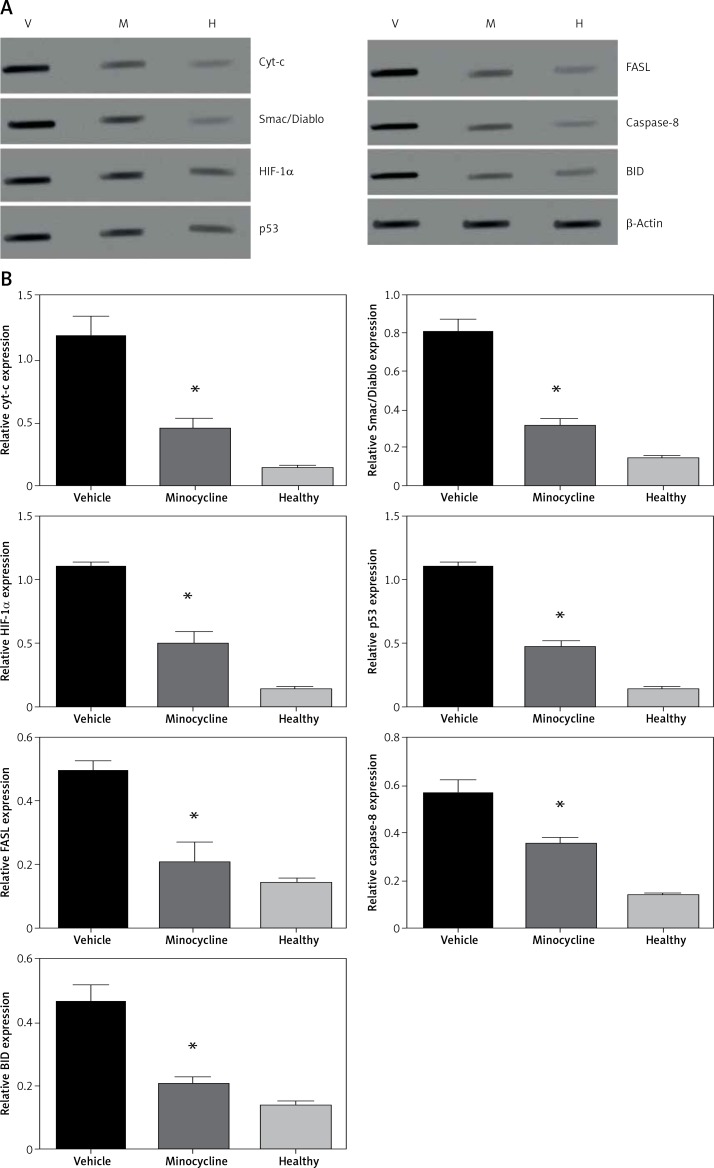
Figure 5.
Western blot analysis. A – The figure represents the western blot of mitochondrial targets where V represents the vehicle, M is the minocycline-treated group and H represents the healthy group. The results were consistent with the mRNA expression analysis of these targets. Caspase-8 and BID expression was included to evaluate the effect of the caspase-dependent pathway in the FAS-mediated cell death mechanism on treatment with minocycline. The images were visualised using Kodak Image Station software. B – Quantification of western blot analysis
All values are expressed as mean ± SEM and considered significant at p < 0.05. *p < 0.05 vs. vehicle group.

