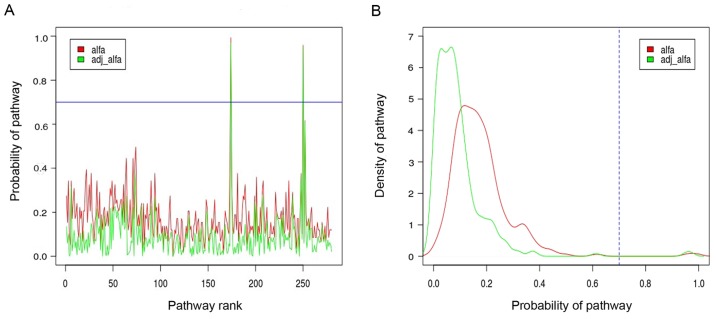
Figure 1.
The probability distribution of 280 pathways. The X axis represents the pathways, and the Y axis is the posterior value of the pathways. (A) The adjusted posterior value distribution of 280 pathways. (B) The density of posterior value distribution of 280 differential pathways. Pathway was regarded as differential pathway according to adjusted posterior value >0.7.

