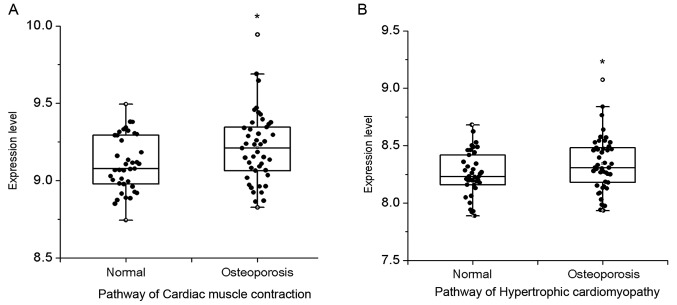
Figure 2.
The differential pathway expression level by box scatter diagram. The pathways expression level of (A) cardiac muscle contraction and (B) hypertrophic cardiomyopathy. The X axis denoted groups, and the Y axis denoted the differential pathways expression level. *P<0.05, indicates statistically significant difference between two groups; °maximum value.

