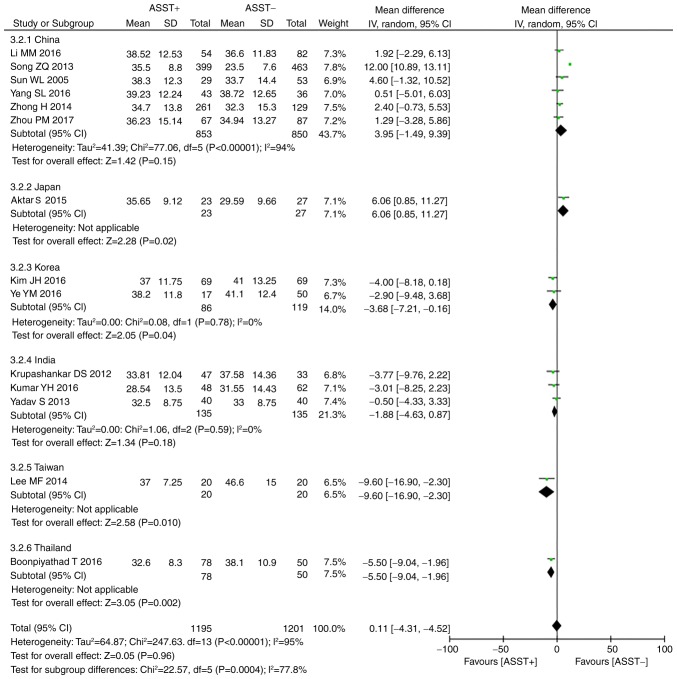
Figure 3.
Difference in age between chronic spontaneous urticaria cases with positive vs. negative ASST responses. Green square, weight of each study; black diamond, weighted mean difference; horizontal lines, 95% CI of each study; SD, standard deviation; IV, inverse variance; CI, confidence interval; ASST, autologous serum skin test; df, degrees of freedom.

