Figure 5.
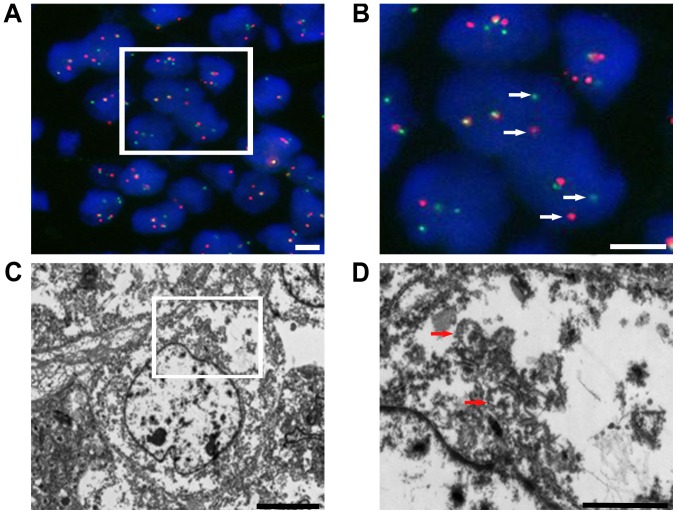
(A and B) Representative image of EWSR1 gene rearrangements. Fluorescence in situ hybridization analysis with a dual-color EWSR1 break-apart probe showed that the analyzed tumor cell presented with at least one fusion signal, and the separated red and green signals (arrowhead), indicative of a rearrangement of one copy of EWSR1. Scale bars, 5 µm. (C and D) Ultrastructural features, including some isolated dense-core secretory granules (arrowhead), irregularly shaped nuclei and prominent nucleoli, were identified. Scale bars, (C) 5 µm and (D) 2 µm. EWSR1, Ewing sarcoma breakpoint region 1.

