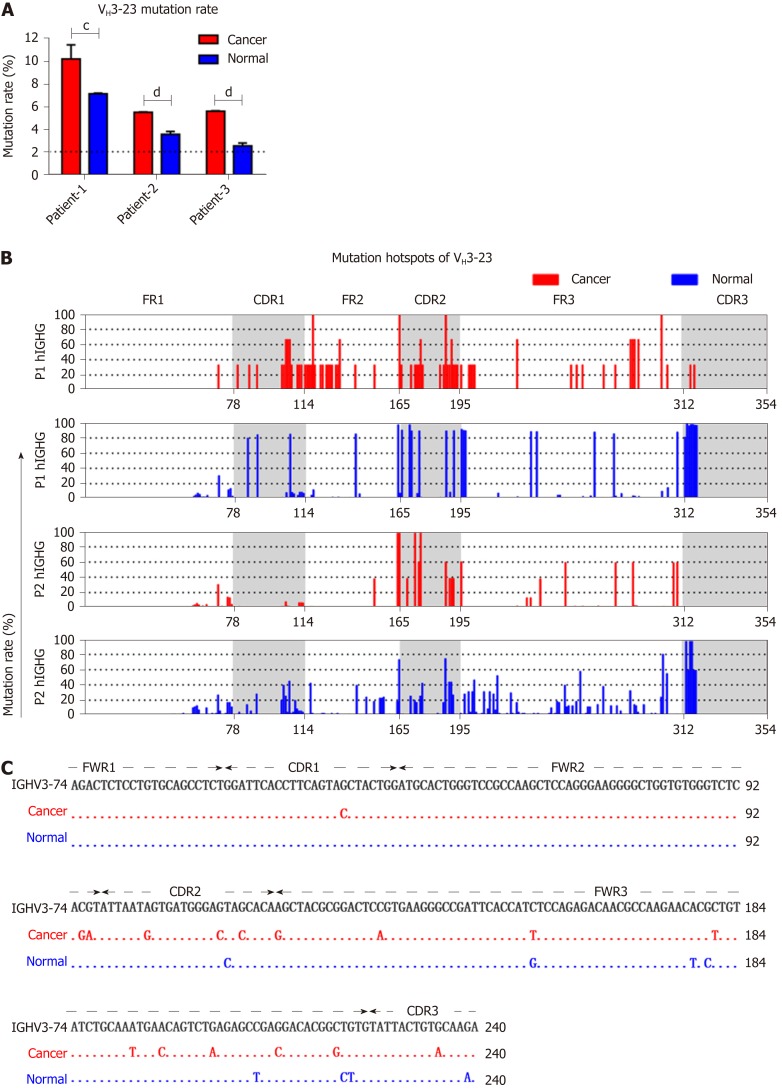
Figure 4.
Somatic hypermutation in colon cancer and normal epithelial cells. A: Mutation rates of VH3-23 in cancer and normal cells. Dotted lines represent the cut-off value 2%; B: Mutant positions and corresponding frequencies of VH3-23 in different patients. P1: Patient-1. P2: Patient-2. The X-axis represents the 1st to 354th nucleotides using IMGT-numbering; C: Representative mutant positions of VH3-74/D6-19/JH4 in cancer and normal cells of patient-3 compared to the germline sequence of VH3-74. Small horizontal lines indicate the mean ± SEM. All data comparing cancer with normal cells were determined by the two-tailed unpaired Student’s t-test. cP < 0.001. dP < 0.0001.

