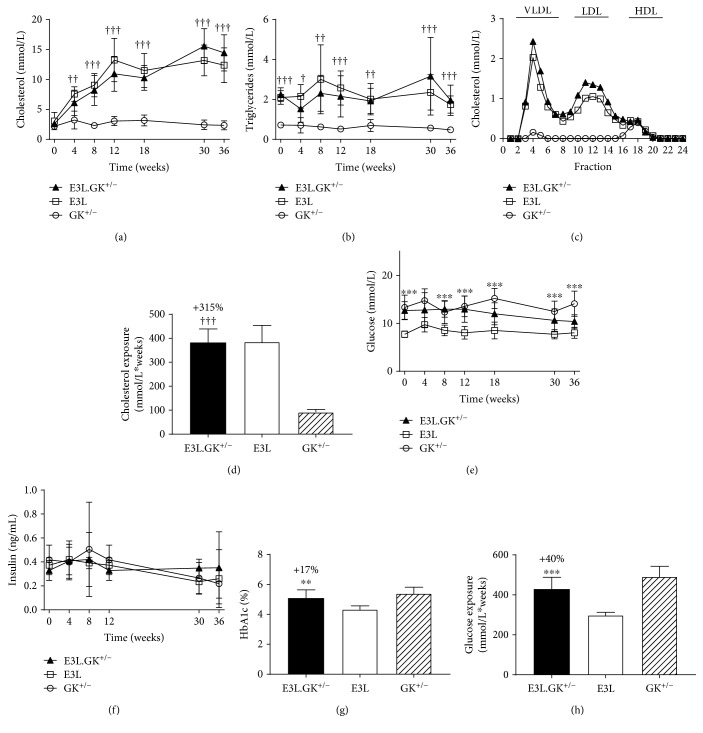
Figure 2.
E3L.GK+/− mice have comparable lipid levels and higher glucose levels as E3L mice. Plasma cholesterol (a) and triglycerides (b) were measured throughout the study. Lipoprotein profiles were assessed by FPLC lipoprotein separation in groupwise-pooled unfasted sacrifice plasma (c). Cholesterol exposure over time was calculated as mmol/L∗weeks (d). Plasma glucose (e) and insulin (f) were measured throughout, HbA1c (%) was measured at week 36 (g), and glucose exposure was calculated as mmol/L∗weeks (h). Significance of differences was calculated parametrically using a one-way ANOVA with Dunnett's post hoc test. E3L.GK+/− compared to E3L: ∗ p < 0.05, ∗∗ p < 0.01, and ∗∗∗ p < 0.001; E3L.GK+/− compared to GK+/−: † p < 0.05, †† p < 0.01, and ††† p < 0.001. Data are presented as means ± SD (n = 8–10 per group and for insulin n = 4–8 per group). FPLC: fast protein liquid chromatography; HbA1c: hemoglobine A1c.

