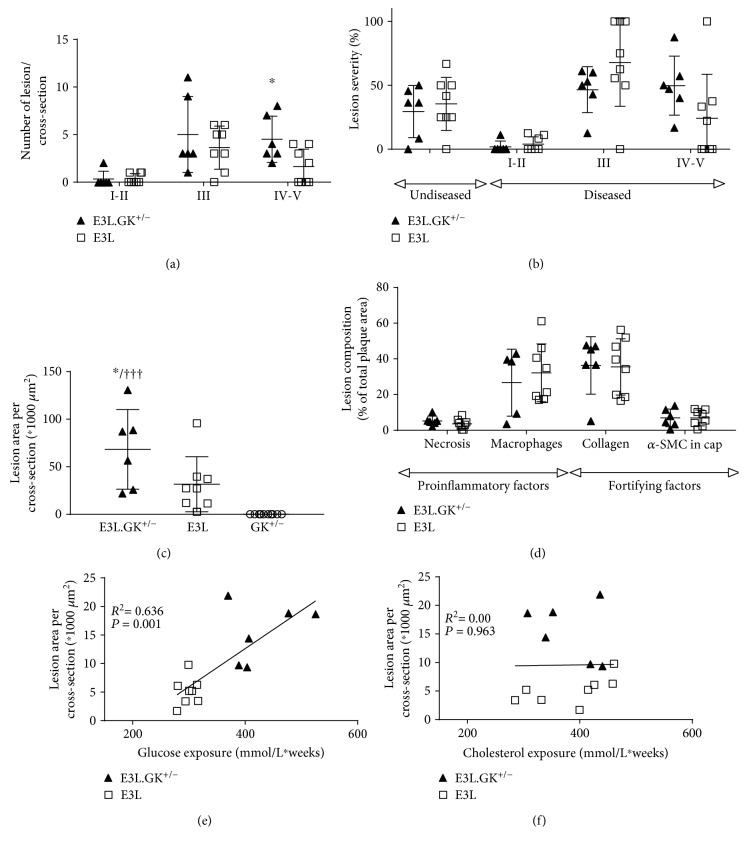
Figure 3.
Atherosclerotic lesion size and severity are aggravated in E3L.GK+/− mice which is correlated to glucose exposure. The number of lesions (a); lesion severity classified as mild (type I–II lesions), moderate (type III), and severe (type IV and V) lesions (b); and atherosclerotic lesion size per cross-section (c). Necrotic and macrophage content as proinflammatory factors and αSMCs and collagen as fortifying factors were determined in type III–V lesions and expressed as percentage of total plaque area (d). Linear regression analyses were performed on the square root of the lesion area plotted against glucose exposure (e) or cholesterol exposure (f). Significance of differences was calculated two-tailed using an independent sample t test (a–d). A multiple regression analysis was performed to predict the effect of variables on lesion size, and linear regression was used to assess correlations between variables (e–f). ∗ p < 0.05 when compared to E3L; ††† p < 0.001 when compared to GK+/−. Data are presented as means ± SD (n = 6-8 per group).

