Figure 5.
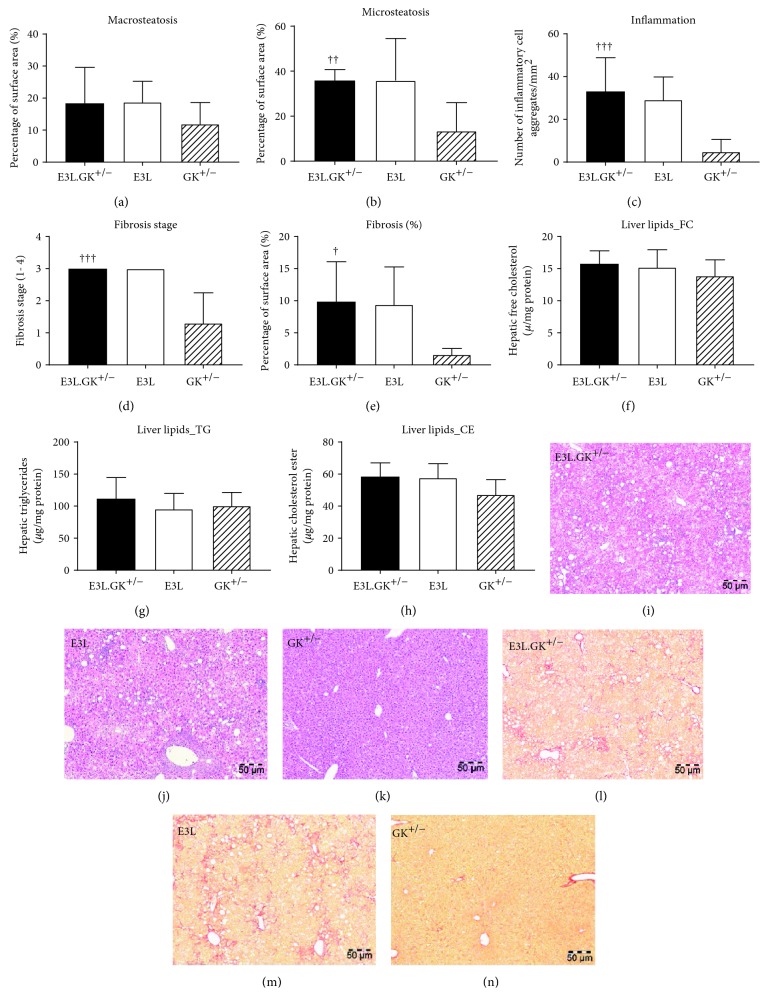
The GK phenotype does not aggravate hepatic steatosis, inflammation, or fibrosis in E3L mice. Macrovesicular steatosis (a) and microvesicular steatosis (b) as percentage of total liver area was determined. The number of inflammatory cell aggregates were counted per mm2 (c). Fibrosis grade (1–4) was scored (d) and percentage of area positive for Sirius Red was measured in ImageJ (e). Intrahepatic free cholesterol (f), intrahepatic triglycerides (g), and intrahepatic cholesterol esters (h) were analyzed by HPTLC. Representative images of HE (i–k) and Sirius Red (l–n) staining at a 5x magnification. Significance of differences was calculated parametrically using a one-way ANOVA with Dunnett's post hoc test. † p < 0.05, †† p < 0.01, and ††† p < 0.001 when compared to GK+/−. Data are presented as means ± SD (n = 6–10 per group). HPTLC: high-performance thin-layer chromatography; HE: hematoxylin-eosin.

