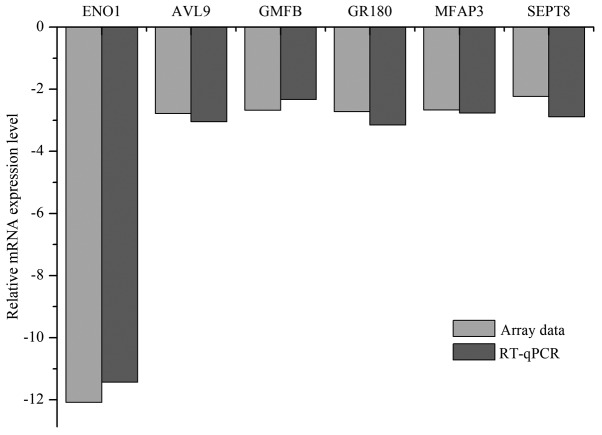
Figure 2.
RT-qPCR verification of the array data. Fold changes of selected genes in NC and ENO1-knockdown groups using microarray and RT-qPCR analyses. RT-qPCR, reverse transcription-quantitative polymerase chain reaction; ENO1, α-enolase; AVL9, AVL9 cell migration-associated; GMFB, glia maturation factor β; GPR180, G-protein-coupled receptor 180; MFAP3, microfibrillar-associated protein 3; SEPT8, septin 8. All values are relative to the negative controls.

