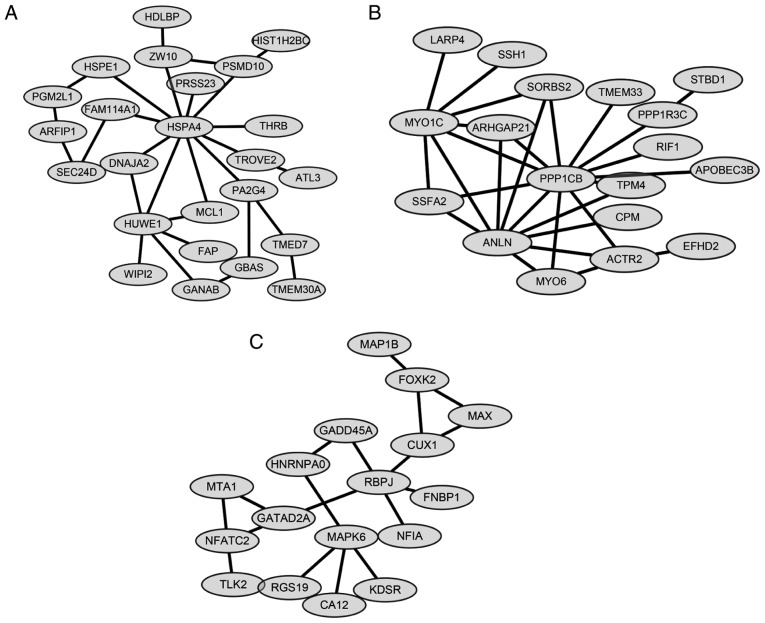
Figure 4.
Modules identified from the network based on BioGRID. Three modules were identified with P<5×10⁻⁴. Module A (nodes, 24; density, 0.101; quality, 0.549; P=7.91×10⁻⁶); Module B (nodes, 18; density, 0.183; quality, 0.683; P=1.36×10⁻⁴) and Module C (nodes, 17; density, 0.132; quality, 0.581; P=4.50×10⁻⁴).

