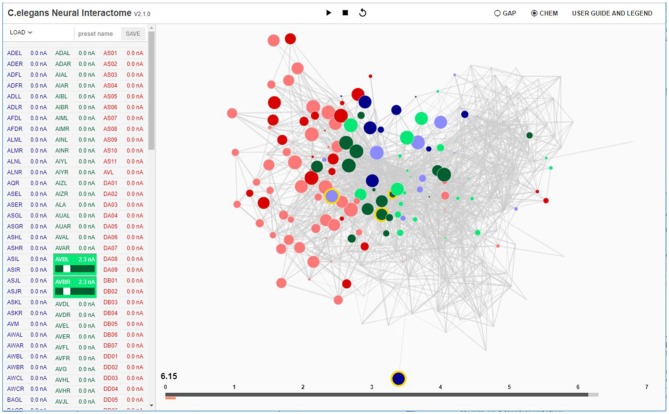
Figure 1.
Interactive interface for Neural Interactome. Left panel enlists all the neurons classified by type (sensory, inter and motor). Each neuron is a clickable button with a scroll option. Scrolling adjusts the magnitude of constant stimulus; shift + click ablates the neuron from the network. Right: Force-directed graph displays each neuron's membrane voltage (node color denotes the sign; radius denotes the magnitude) and connections between neurons (edges between each pair of nodes). At the bottom of the graph, time bar keeps track of visualized time point (dark gray), and of computed time by the backend neural integration (light gray).

