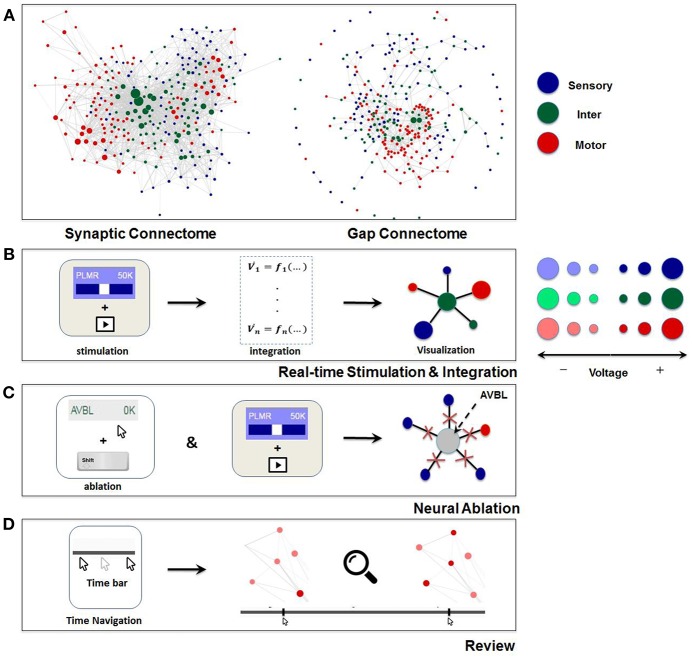
Figure 2.
Visualization and main functionalities of Neural Interactome. (A) Force-directed graph visualization of C. elegans worm's synaptic (chemical, left) and gap (electrical, right) connectomes. Each node represents individual neuron colored according to its group type and edges represent connections (either synaptic or gap). (B) Schematics of Neural Interactome real-time stimulation and integration component; when user stimulates a neuron with the interface, the backend integrator computes membrane voltages in response to the stimuli, which are then visualized on the graph in respect to their signs and magnitudes. (C) Neural ablation is performed by clicking on the neuron, while holding the shift key. Ablation disconnects all the connections of the neuron (both gap and synaptic). (D) The review system implements a clickable time bar to allow navigation to any previously computed time point in the simulated dynamics. This is further enhanced with dynamics zoom-in/zoom-out feature designed for in-depth analysis of connectivity structure and local dynamics of sub-circuits.

