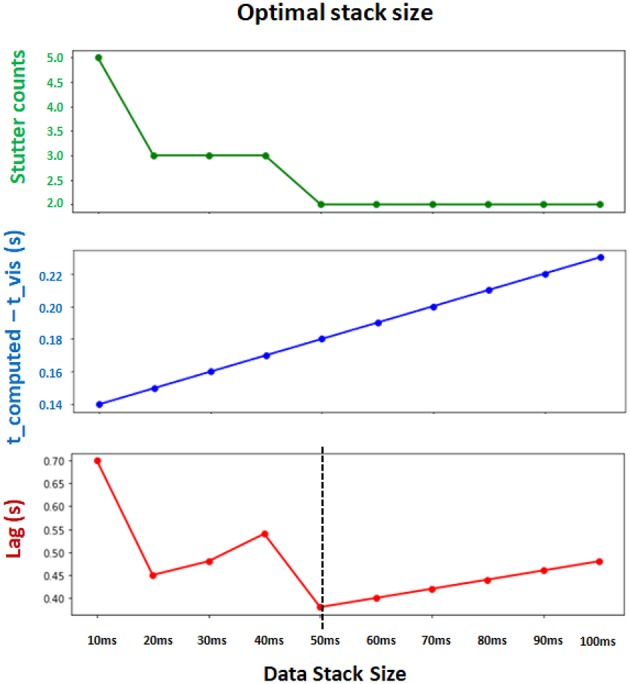
Figure 6.

Determining the optimal Δt (data stack size) for synchronization and computational efficiency. Two evaluation metrics are collected for different choices of stack size. t_computed − t_vis measures the synchronization between the leading integration time point in backend and leading visualization time point in frontend (lower is better). Stutter counts represents the computational efficiency by counting the number of stutters (i.e., when visualization pauses with t_computed = t_vis; lower is better). Both metrics are measured with identical sessions of 10 s simulation. Final evaluation metric (Lag) is obtained by multiplying these two metrics (lower is better). The results show that Δt = 50 ms achieves the minimum lag, and supports the best balance between synchronization and computational efficiency.
