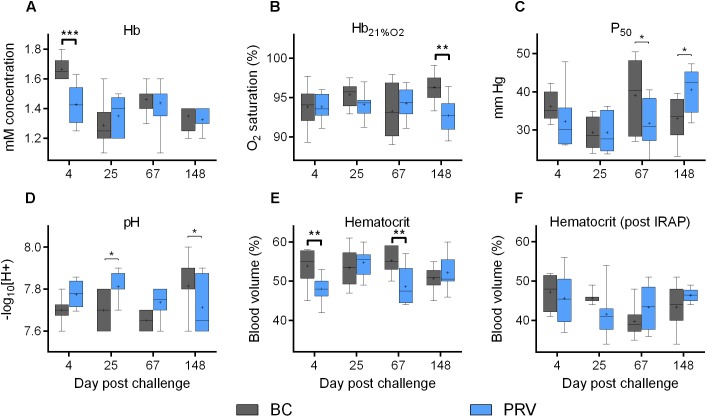
FIGURE 3.
Erythrocyte oxygen transport capabilities of PRV infected Atlantic salmon. Bar and whisker plots (bar = 25–75 percentile; whiskers = min–max; line = median; plus = mean; n = 8) of five blood associated indices measured at 4 discrete sampling events. Significant difference (∗p < 0.05; ∗∗p < 0.01; ∗∗∗p < 0.001) in mean value between blood control injected (BC) and PRV injected (PRV) treatment groups are indicated at each time point as determined by uncorrected Fisher’s LSD comparison tests. Significance (p < 0.05) following family-wise p-value multiplicity adjustment (Bonferroni, Sidak, Holm–Sidak tests; α = 0.05) is indicated in bold. (A–E) Data collected from fish that did not undergo IRAP. (F) Data collected from fish immediately after IRAP. Hb, hemoglobin; Hb21%O2, Hb saturation at 21% oxygen; P50, partial pressure at 50% oxygen saturation.

