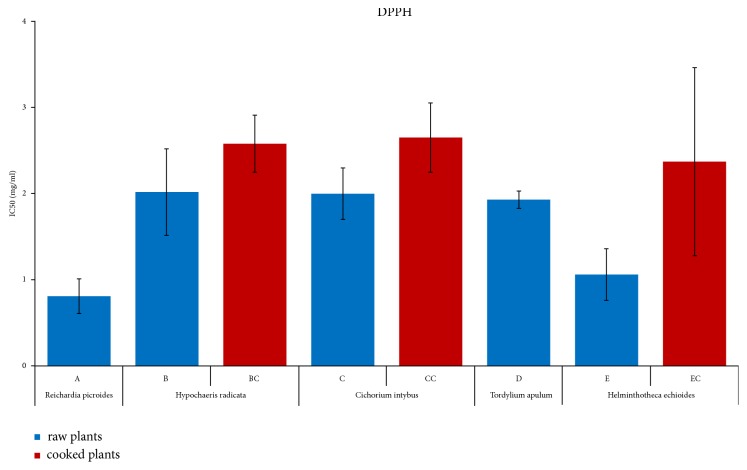
Figure 1.
DPPH assay of the raw and cooked plant extracts. The average antioxidant capacity for four plants of each species either raw (A-E) or cooked (BC, CC, and EC) is presented as IC50, i.e., the inhibition concentration that halves the DPPH radical activity. Lower IC50 values indicate higher antioxidant capacity. Statistical analyses of all average data were performed using ANOVA.

