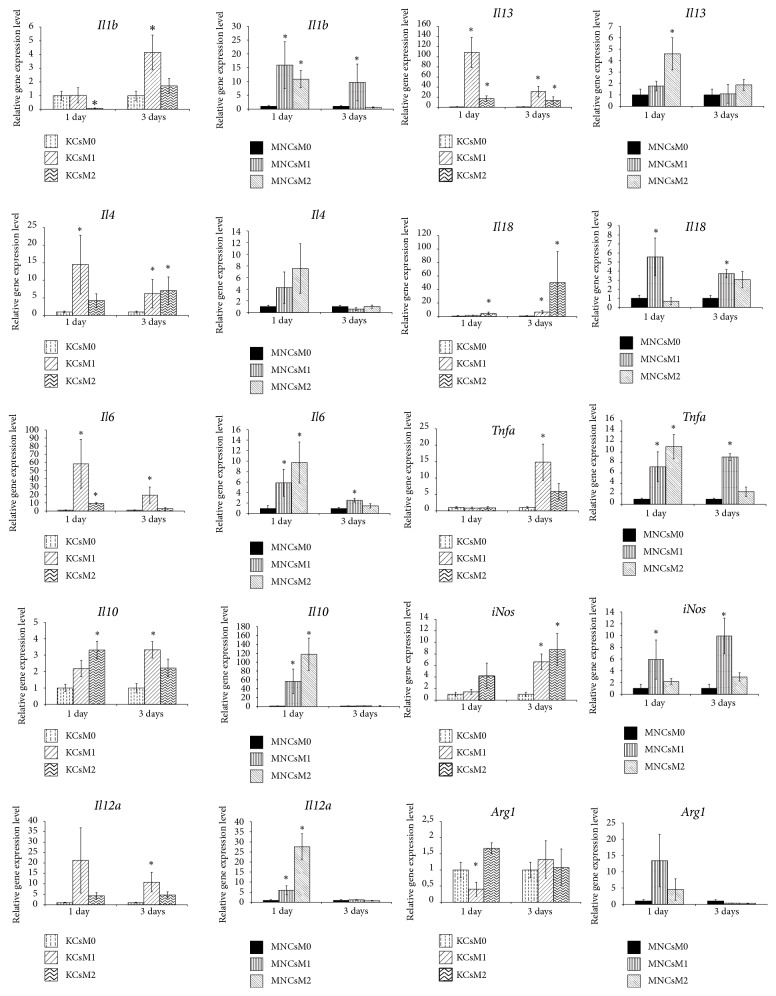
Figure 4.
Gene expression profiles for cultured MNCs and KCs in different states (nonactivated and either M1- or M2-induced at consecutive time points of 1 and 3 days after the onset of activation). The data is presented as means with the bars for standard deviations. Horizontal axes represent time after the onset; vertical axes represent expression level in relative units. The asterisks indicate significant differences from the corresponding values for the nonactivated M0 macrophages; p<0.05; KCs: Kupffer cells; MNCs: macrophages of monocytic lineage.

