
Figure 3.
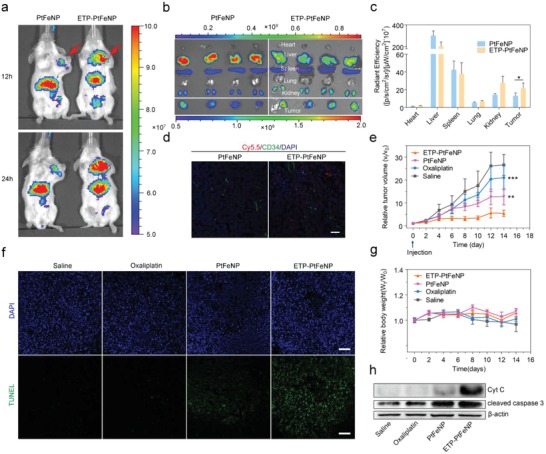
In vivo study of ETP‐PtFeNP formulations. a) In vivo images of tumor‐bearing mice intravenously administrated with Cy5.5‐labeled formulations at 12 and 24 h post the injection by IVIS. b) Ex vivo images of excised organs isolated from tumor‐bearing mice by IVIS at 24 h post the injection. c) Biodistribution of the Cy5.5‐labeled nanoparticles 24 h after intravenous injection into tumor‐bearing mice (n = 4). d) CD34‐staining and nanoparticle distribution in frozen tumor sections from tumor‐bearing mice at 24 h after administration with Cy5.5‐labeled nanoparticles. Scale bar: 30 µm. e) Tumor volume change and g) body weight change of 4T1 breast tumor‐bearing mice after intravenously injected with different oxaliplatin formulations. Data are presented as means ± SD (n = 6). f) TUNEL assay of 4T1 tumor xenografts excised from mice models. Scale bars: 100 µm. h) Western blotting analysis of Cyt C and cleaved caspase‐3 expression in 4T1 tumor xenografts tissues. Significance is defined as *P < 0.05, **P < 0.01, ***P < 0.001.