
Figure 2.
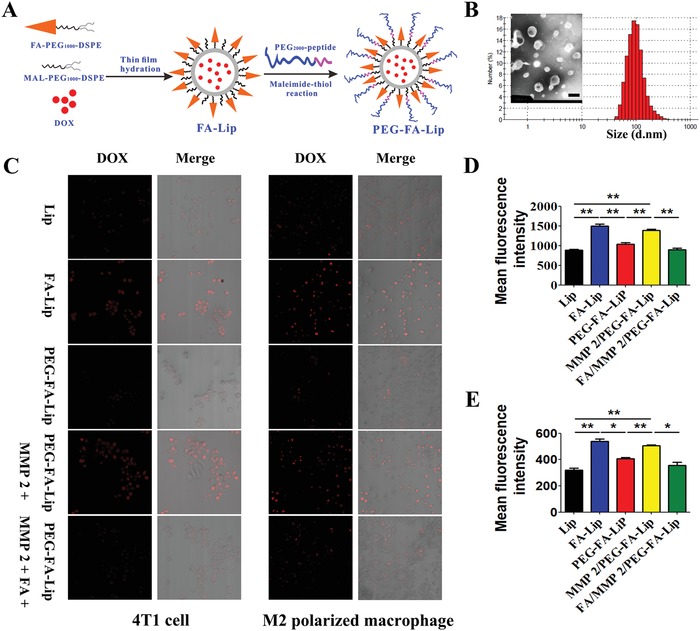
In vitro characterization of PEG‐FA‐Lip and evaluation of its dual‐targeting efficacy. A) Schematic illustration of preparing PEG‐FA‐Lip. B) Size distribution and TEM image of PEG‐FA‐Lip. Scale bar = 200 nm. C) Confocal images (200×) of cellular uptake on 4T1 cells and M2 polarized macrophages (RAW 264.7 cells with IL‐4). D,E) Quantitative cellular uptake of Lip, FA‐Lip, and PEG‐FA‐Lip on 4T1 cells (D) and M2 polarized macrophages (E) after incubation for 1 h at the DOX concentration of 10 µg mL−1. * P < 0.05, ** P < 0.01. Data represent the mean ± SD (n = 3).