
Figure 4.
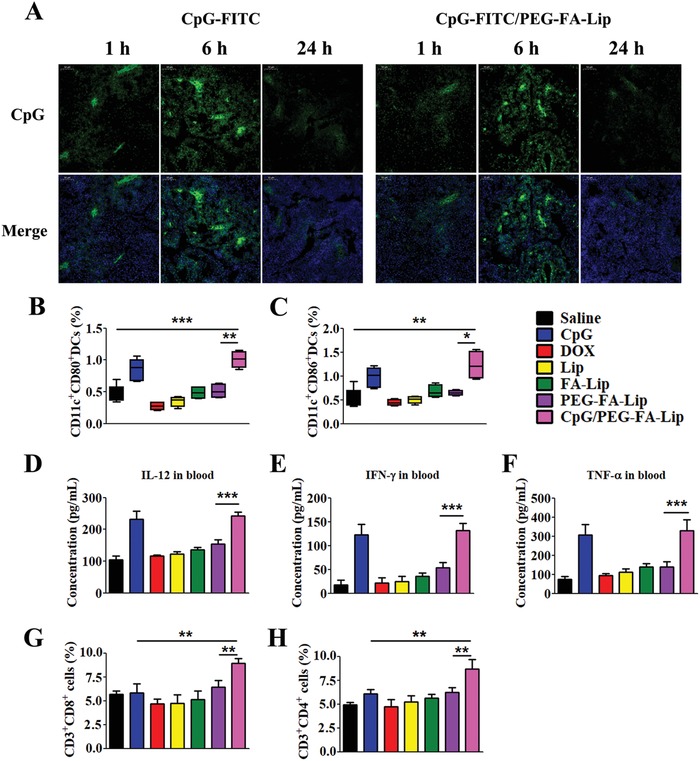
CpG facilitating PEG‐FA‐Lip induced “tumor vaccines” to activate effector T cells in TDLNs. A) Confocal images (200×) showing the distribution of CpG in TDLNs at 1, 6, and 24 h after breast cancer‐bearing mice treated with CpG or CpG/PEG‐FA‐Lip. (CpG was labeled with FITC and is represented in green, nuclei were labeled with DAPI and are represented in blue.) The CpG/PEG‐FA‐Lip group was pretreated with PEG‐FA‐Lip via intravenous injection. The CpG‐FITC was subcutaneously injected into the left axilla of mice at 24 h after PEG‐FA‐Lip treatment. B,C) DC maturation. Proportions of DCs expressing CD80 (B) and CD86 (C) in TDLNs after the indicated treatment. D–F) Immunostimulatory cytokines secretion. ELISA results of IL‐12p70 (D), IFN‐γ (E), and TNF‐α (F) secretion in blood after the indicated treatment. G,H) Effector T cells activation. Relative abundance of CD3+CD8+ cells (G) and CD3+CD4+ cells (H) in TDLNs after the indicated treatment. * P < 0.05, ** P < 0.01, *** P < 0.001. Data represent mean ± SD (n = 5).