
Figure 7.
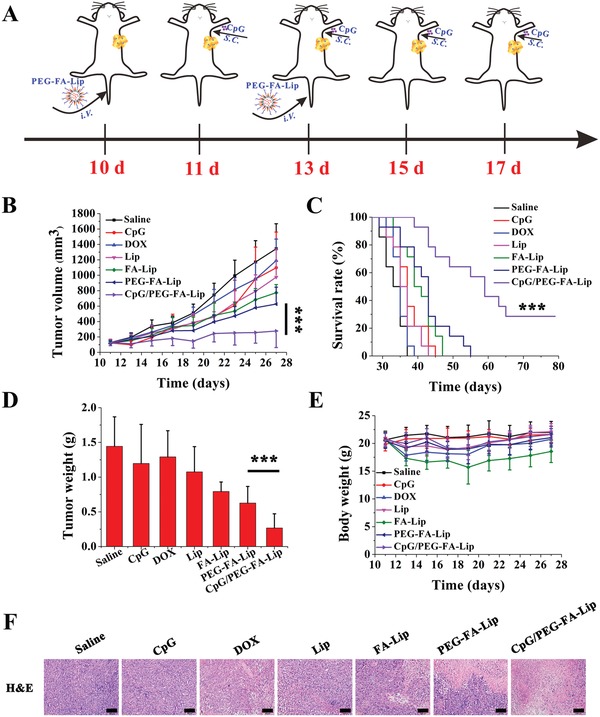
In vivo antitumor efficacy of PEG‐FA‐Lip in combination with CpG. A) Schematic illustration of PEG‐FA‐Lip and CpG combination treatment. B) Tumor growth curves of 4T1 bearing‐mice after being intravenously injected with DOX, Lip, FA‐Lip, and PEG‐FA‐Lip at day 10 and 13, followed by subcutaneous administration of CpG at day 11, 13, 15 and 17 (DOX dose, 5 mg kg−1; CpG dose, 4 µg per mouse). Data represent mean ± SD (n = 13). C) Kaplan–Meier survival curves of different formulations‐treated 4T1 tumor‐bearing mice. Data represent mean ± SD (n = 13). D) Weights of excised tumors at the endpoint of the experiment. Data represent mean ± SD (n = 13). *** P < 0.001. E) Body weights of 4T1 bearing‐mice from different groups. Data represent mean ± SD (n = 13). F) H&E staining of the 4T1 tumor tissues collected at the endpoint of the experiment from different groups of mice (n = 5). Scale bar = 100 µm.