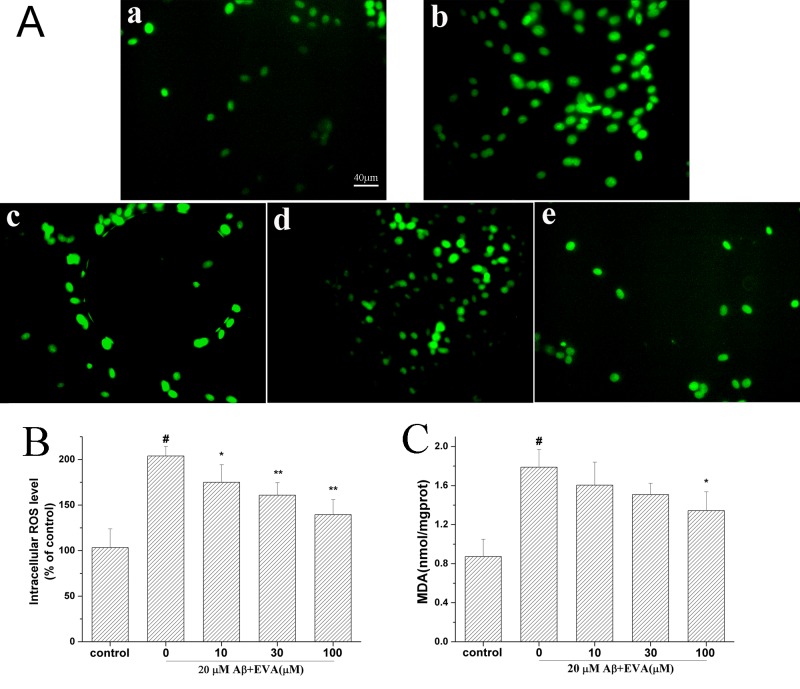
Figure 4.
Protective effect of EVA on oxidative stress in Aβ1-42-treated PC12 cells. Cells were incubated in the absence of Aβ1-42 (control) or in the presence of 20 µM of Aβ1-42 following pretreatment with different concentrations of EVA. (A) ROS production was measured with a fluorescence microscope (magnification, ×200). a, Control group. b, 20 µM Aβ1-42 single treatment. c, 20 µM Aβ1-42+10 µM EVA. d, 20 µM Aβ1-42+30 µM EVA. e, 20 µM Aβ1-42+100 µM EVA. (B) ROS levels were measured using a standard assay. Data are presented as the percentage of the control group and expressed as the mean ± standard deviation (n=3). (C) MDA content was measured with an MDA assay. The results are expressed as the mean ± standard deviation (n=5). #P<0.01 compared with the control group untreated with Aβ1-42. *P<0.05 and **P<0.01 compared with the Aβ1-42-treated group. ROS, reactive oxygen species; EVA, ethyl vanillin; Aβ, β-amyloid; MDA, malondialdehyde.

