FIGURE 4.

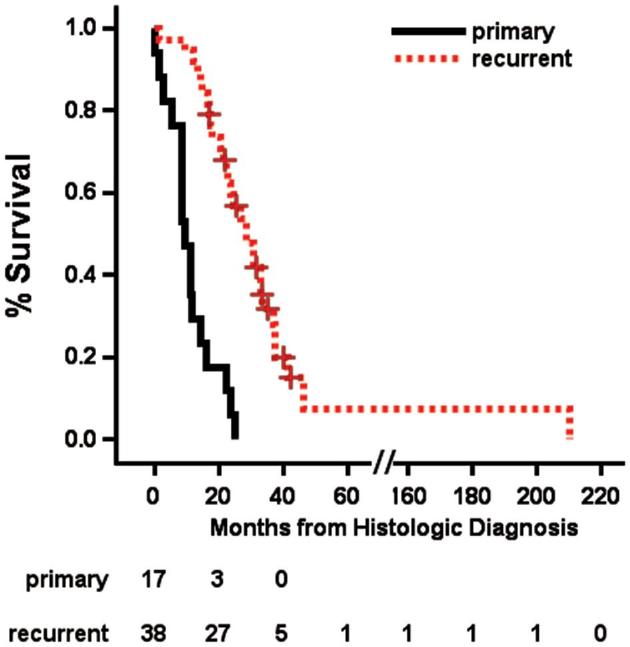
OS in primarily treated vs recurrent GBM from time of histologic diagnosis. OS for the primarily treated group was 9.1 mo, and for the recurrent group, 22.3 mo (P < 0.0001).

OS in primarily treated vs recurrent GBM from time of histologic diagnosis. OS for the primarily treated group was 9.1 mo, and for the recurrent group, 22.3 mo (P < 0.0001).