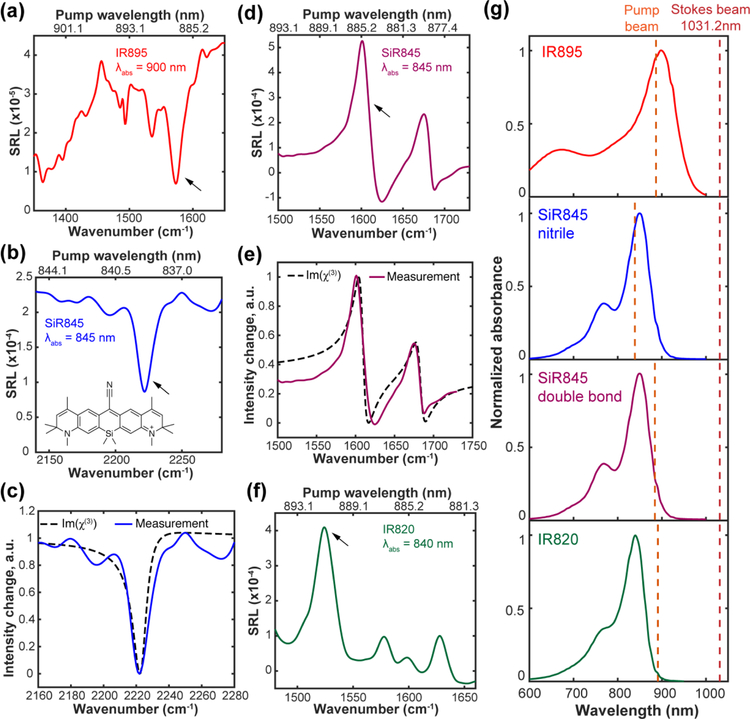
Figure 4. Raman band-shape change in electronic resonance SRS (er-SRS) microspectroscopy.
(a) IR895 (saturated solution in methanol, ~50 μM) with inverted Lorentzian shape. (b) Clean inverted Lorentzian shape for the nitrile mode of SiR845 (500 μM in acetic acid). (c) Comparison of measured band shapes with calculated shapes using eq 1 for nitrile mode of SiR845. (d) Dispersive shapes for the double bond modes of SiR845 (500 μM in acetic acid). (e) Comparison of measured band shapes with calculated shapes using eq 1 for the double bond modes of SiR845. (f) Slightly dispersive shape for the double bond modes of IR820 (500 μM in DMSO). Power were set as Ppump=500 μW and PStokes=43 mW for IR820 and SiR845, and Ppump≈20 μW and PStokes=32 mW for IR895. (g) Absorption spectra and excitation condition of IR absorbing dyes. Red dashed line for position of fixed Stokes beam. Orange dashed lines are the pump wavelength for arrowed peaks in (a), (b), (d) and (f). The following parameters were used for SiR845 simulations: ωR = 11834 cm−1 and Γe = 430 cm−1 as estimated from the absorption spectrum. ΓR is estimated to be 5 cm−1 for nitrile mode and 6.2 cm−1 for double bond mode based on the linewidth of MARS dyes peaks in the pre-resonance case.

