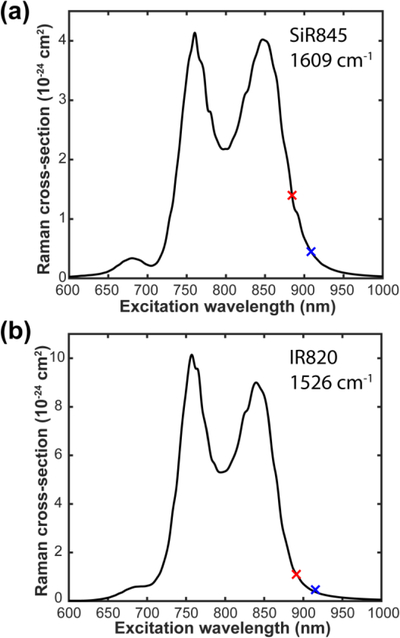
Figure 5. Raman excitation profile.
(a) Raman excitation profile for the 1609 cm−1 band of SiR845. (b) Raman excitation profile for the 1526 cm−1 band of IR820. The red and blue cross markers are experimentally measured Raman cross sections under different pump wavelength with Stokes fixed at 1031.2 nm and 1064.2 nm, respectively.

