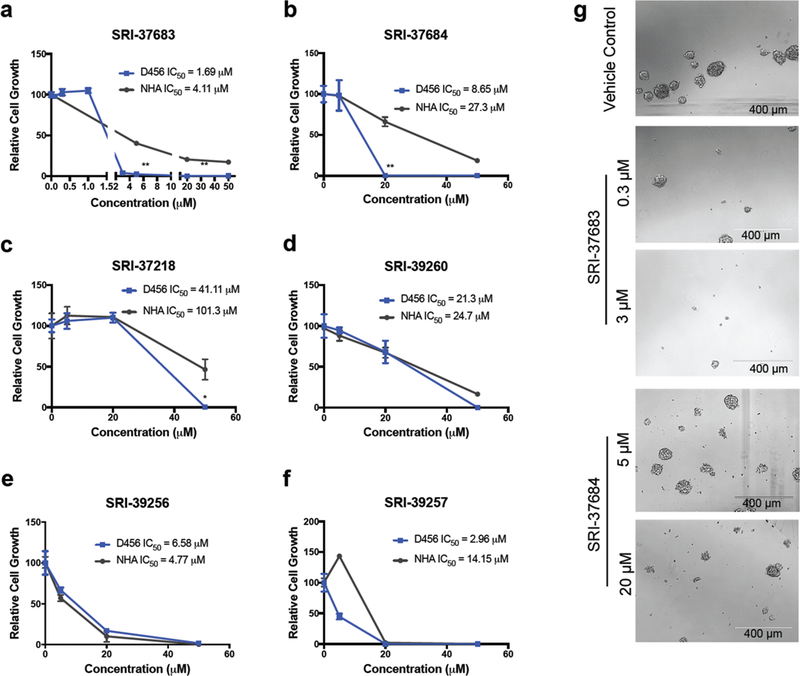
Figure 4. Potential GLUT antagonists display differential effects on GBM PDX cells and NHAs.

Cell growth of D456 GBM PDX and NHA cells following treatment with (a) SRI-37683 (**p < 0.001 one-ay ANOVA and Dunnett’s multiple comparisons between D456 and NHA treated with 5 μM and 20 μM) (b) SRI-37684 (**p < 0.001 one-ay ANOVA and Dunnett’s multiple comparisons between D456 and NHA treated with 5 μM) (c) SRI- 37218 (**p < 0.005 one-ay ANOVA and Dunnett’s multiple comparisons between D456 and NHA treated with 50 μM) (d) SRI-39260 (e) SRI-39256 (f) SRI-39257 at indicated concentrations for 7 days (g) Representative images of D456 GBM PDX cells on day 7 after treatment with indicated concentrations of antagonists. (Representative data from 3 experiments with n=3 per group)
