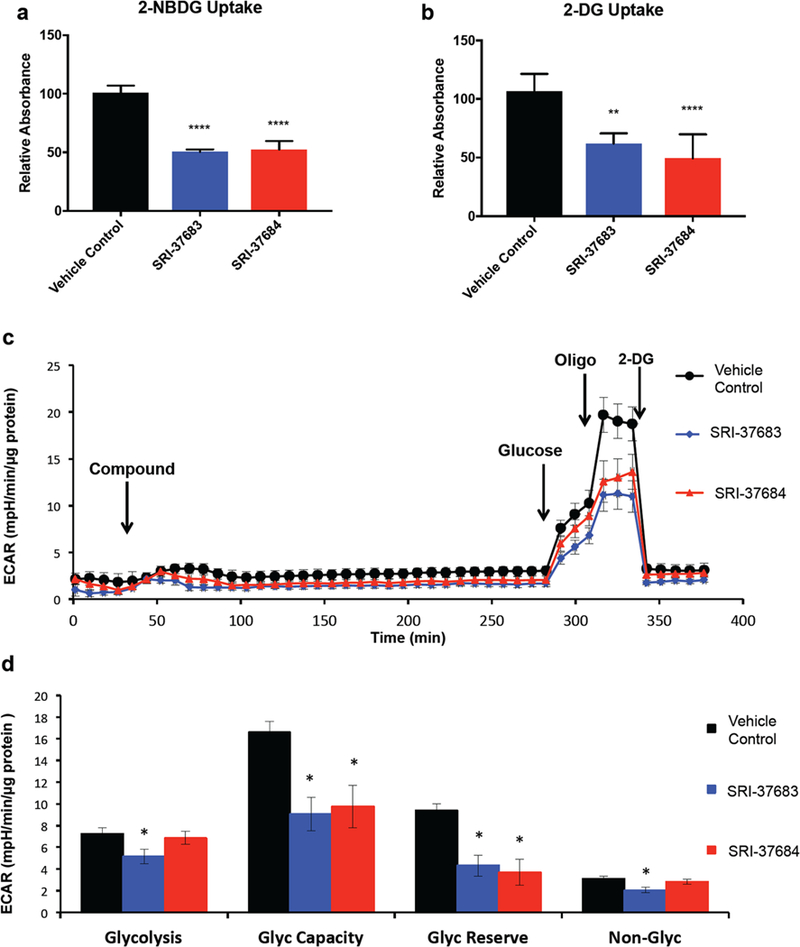
Figure 6. Glucose uptake is inhibited by novel potential GLUT inhibitors.

a) Compounds inhibited 2-NBDG uptake as measured in D456 GBM PDX cells. (Averaged data from 2 experiments with n=3 per group * p<0.0001 One-way ANOVA with Tukey’s multiple comparisons) b) 2-DG uptake is inhibited by identified compounds in D456 GBM PDX cells. (Averaged data from 2 experiments with n=3 per group * p<0.0001 One-way ANOVA with Tukey’s multiple comparisons). c) Representative traces of extracellular acidification rate (ECAR) over time, (Representative data (mean ± sem) from 2 experiments with n=6 per group) d) Quantification of glycolytic flux parameters after glycolysis stress test; glycolysis (ECAR after Glucose - basal ECAR), Glycolytic capacity (ECAR before 2-DG minus ECAR after 2-DG), Glycolytic Reserve (ECAR after Oligo minus ECAR before Oligo), and Non-Glycolytic after injection of 2-DG. (Representative data (mean ± sem) from 2 experiments with n=6 per group, * p<0.05 student’s t-test compared to control).
