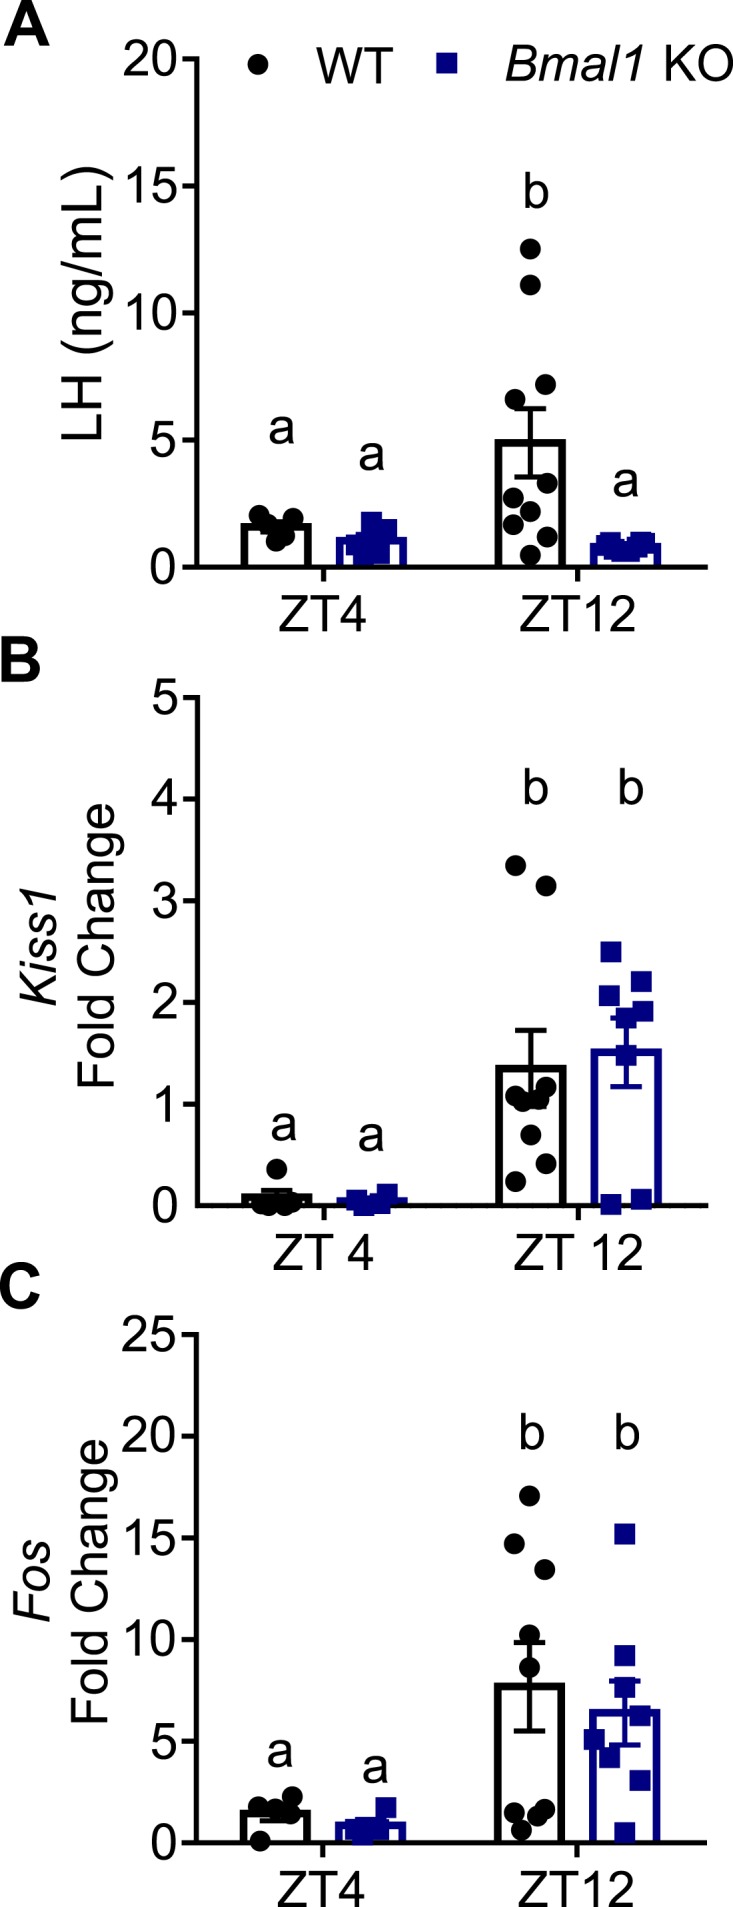
Figure 1.

Bmal1 KO females do not display an LH surge at lights out, despite increased AVPV Kiss1 and Fos mRNA. (A) LH values at ZT4 and ZT12 (lights off) in an induced surge model (n = 5 to 10; two-way ANOVA, effect of genotype; F1,24 = 4.99, P = 0.035); Sidak post hoc multiple comparisons test). (B) Kiss1 mRNA fold change relative to WT ZT12 from AVPV micropunches (n = 4 to 9; two-way ANOVA, effect of time; F1,22 = 14.44, P = 0.0010). (C) Fos mRNA fold change relative to WT ZT4 from AVPV micropunches (n = 4 to 9; two-way ANOVA, effect of time; F1,22 = 9.147, P = 0.0062). Different letters indicate significantly different groups (P < 0.05).
