Fig. 10.

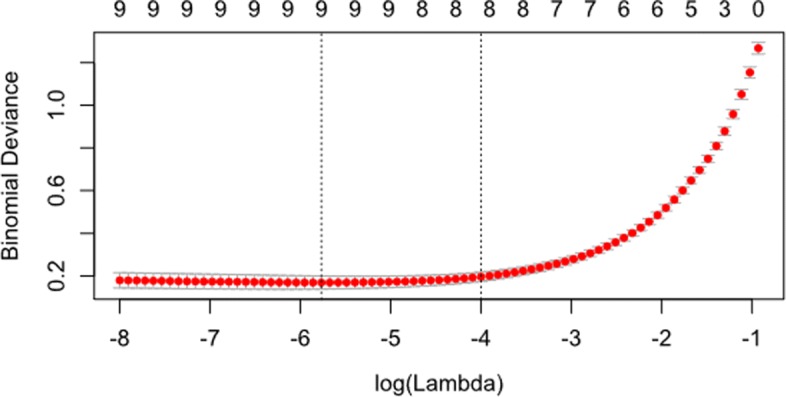
Cross-validation curves for the GLM model. The figure shows the cross-validation curves as the red dots with upper and lower standard deviation shown as error bars

Cross-validation curves for the GLM model. The figure shows the cross-validation curves as the red dots with upper and lower standard deviation shown as error bars