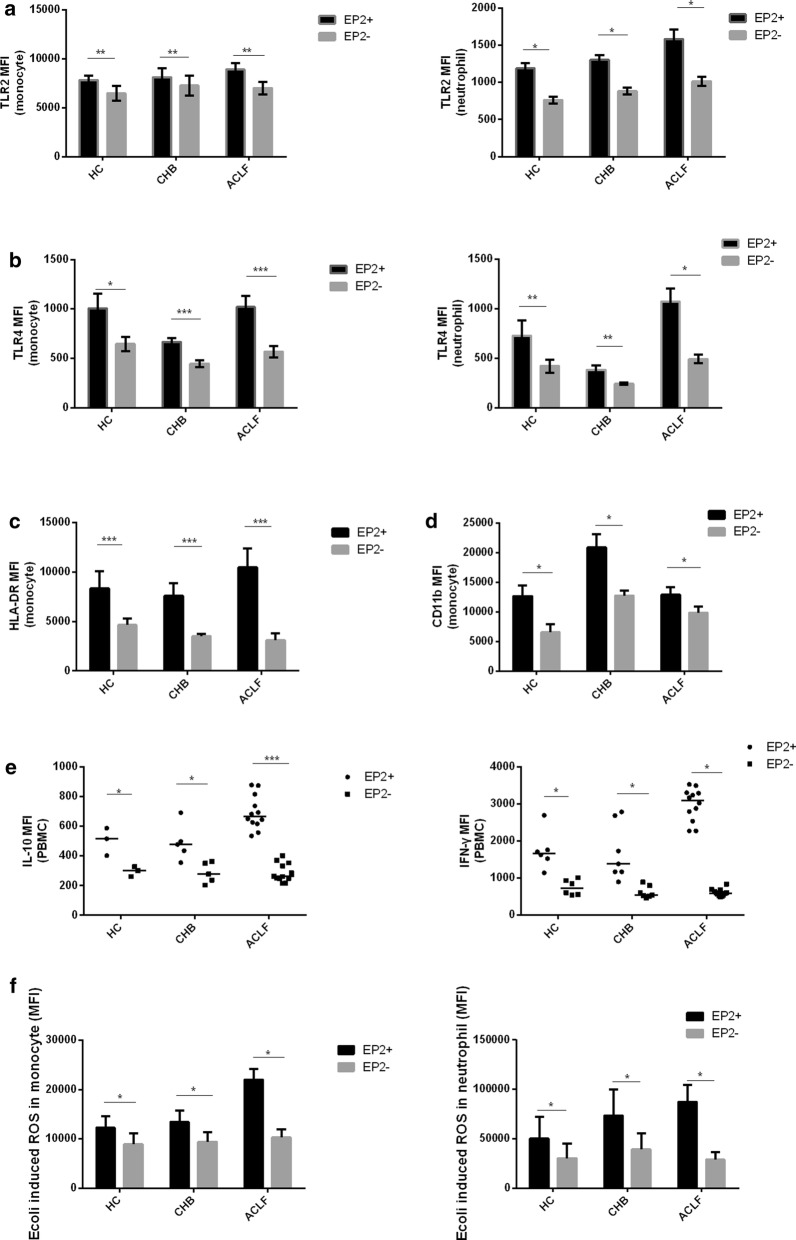
Fig. 5.
Characterization of EP2-positive immune cells. a–d Peripheral whole blood (at least 5 subjects per group) was stained with anti-CD14, anti-CD16, anti-EP2, anti-TLR2, anti-HLA-DR, anti-CD11b or anti-TLR4. The percentages of different phenotypes of EP2+ or EP2− monocytes and neutrophils were determined by flow cytometry. e PBMCs isolated from at least 3 subjects per group were stimulated with LPS (100 ng/ml) for 72 h. Cytokine production was measured by flow cytometry. f Peripheral whole blood from 7 subjects per group was incubated with E. coli for 30 min. ROS production in neutrophils and monocytes was assessed by flow cytometry. The data are expressed as the mean ± SEM of individual subjects or plots of individual data. The error bar represented SEM and the horizontal line represented the median. Statistical analyses were analyzed using the Wilcoxon signed-rank test. *p < 0.05, **p < 0.01, ***p < 0.001; ns, not statistically significant

