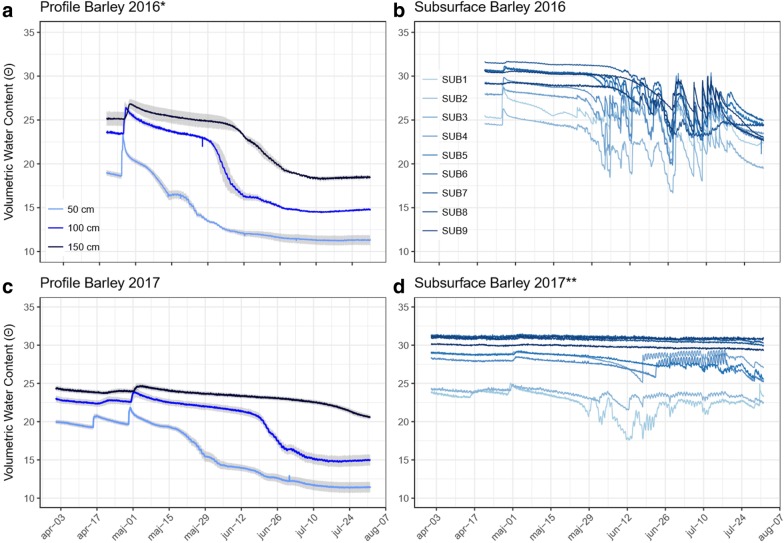
Fig. 7.
Volumetric water content (VWC) measurements from two experiments of spring barley. The subplots to the left (a, c) represent the mean VWC of three soil layers in the middle of each bed and the corresponding standard error, shown as a blue shade (n50cm = 8, n100cm = 4, n150cm = 4). Subplots b and d show VWC data from the 9 subsurface irrigation compartments from the top section (SUB1, light blue) to the bottom section (SUB9, dark blue). *The 2016 experiment was made in one unit only (n50cm = 4, n100cm = 2, n150cm = 2). **The 2017 experiment was made in units 1 and 2, while the 2016 experiments were made in unit 3. The depths and slope angle of the subsurface irrigation compartments are different

