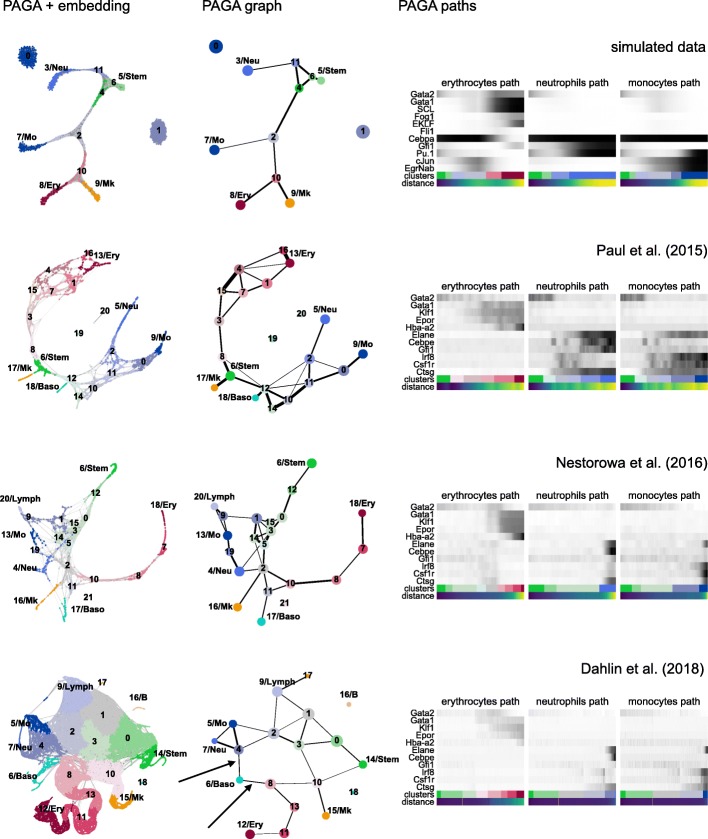
Fig. 2.
PAGA consistently predicts developmental trajectories and gene expression changes across datasets for hematopoiesis. The three columns correspond to PAGA-initialized single-cell embeddings, PAGA graphs, and gene changes along PAGA paths. The four rows of panels correspond to simulated data (Additional file 1: Note 5) and data from Paul et al. [24], Nestorowa et al. [25], and Dahlin et al. [26], respectively. The arrows in the last row mark the two trajectories to basophils. One observes both consistent topology of PAGA graphs and consistent gene expression changes along PAGA paths for 5 erythroid, 3 neutrophil, and 3 monocyte marker genes across all datasets. The cell type abbreviations are as follows: Stem for stem cells, Ery for erythrocytes, Mk for megakaryocytes, Neu for neutrophils, Mo for monocytes, Baso for basophils, B for B cells, Lymph for lymphocytes

